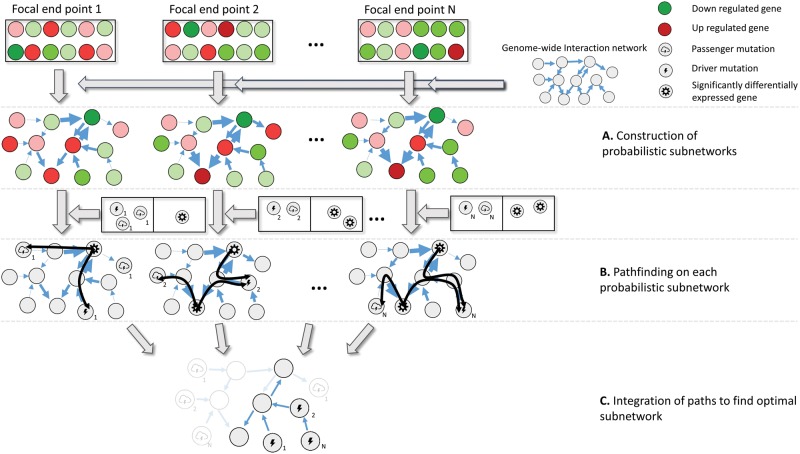
Fig. 1.—
Overview of the network-based eQTL method. The input of the method consists of, respectively, coupled genotype and expression phenotype data for a set of evolved lines with the same phenotype and a genome-wide interaction network. Red and green indicate, respectively, over- and underexpression with respect to a reference. Genes that are considered to be significantly differentially expressed according to a test statistic are indicated by a specific symbol as displayed on the figure legend. Mutated driver and passenger genes are indicated with two different symbols as displayed on the legend. The numbering of each mutated gene indicates the evolved line in which this mutated gene occurred. (A) Construction of the end point specific probabilistic subnetworks: for each evolved line the genome-wide interaction network is converted into a probabilistic subnetwork by assigning to each edge in the genome-wide interaction network a weight that is interpreted as the probability that the edge has an influence on the assessed phenotype. These weights depend on the level of differential expression of the terminal node of the edge. Genes that are more differentially expressed (darker red/green) will give rise to higher weights on the edges (indicated by the width of the edge). (B) Pathfinding in each of the probabilistic subnetworks. The mutated and significantly differentially expressed genes occurring in each of the evolved lines are mapped to the corresponding end point specific probabilistic subnetworks. For each significantly differentially expressed gene, all possible paths from this gene to all mutated genes in the same end point are searched for (paths are shown as black curves). (C) Optimal subnetwork selection. Optimization is performed by integrating the paths found in all end point specific probabilistic networks according to a predefined cost function that positively scores the addition of paths connecting pairs of mutated genes-differentially expressed genes observed in any of the end points, but that penalizes the addition of edges. As a result, paths that are strongly connected to the expression phenotype and that overlap with each other are selected as the optimal subnetwork.

