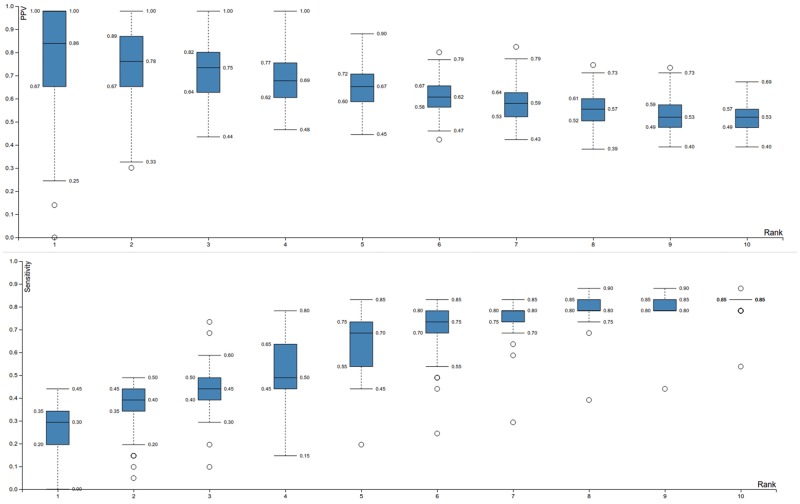
Fig. 2.—
Performance assessment of the network-based eQTL method on the semisynthetic data set. Data of all selected mutated genes at specific ranks are presented as Tukey boxplots. Note that multiple mutated genes can have identical ranks as ranks are assigned based on the maximal edge cost for which a mutation is present within the subnetwork and thus multiple mutated genes can have identical maximal edge costs for which they are present within the subnetwork. The upper plot shows the PPV, (fraction of the selected mutations which are true positives, i.e. driver mutations) in terms of the ranks of the selected mutations. It can be seen that low ranks have higher PPV values. Note that at rank 1, the variance is high. This is because inferred subnetworks for rank 1 are small, and therefore more prone to random effects. That is the selection of one additional false positive in a particular random set largely affects the PPV. Solutions are clearly less variable from rank 2 onwards. The lower plot shows the sensitivity (fraction of all possible true positives selected) in terms of the ranks of the selected mutations. Sensitivity increases with rank, implying a trade-off between PPV and sensitivity.

