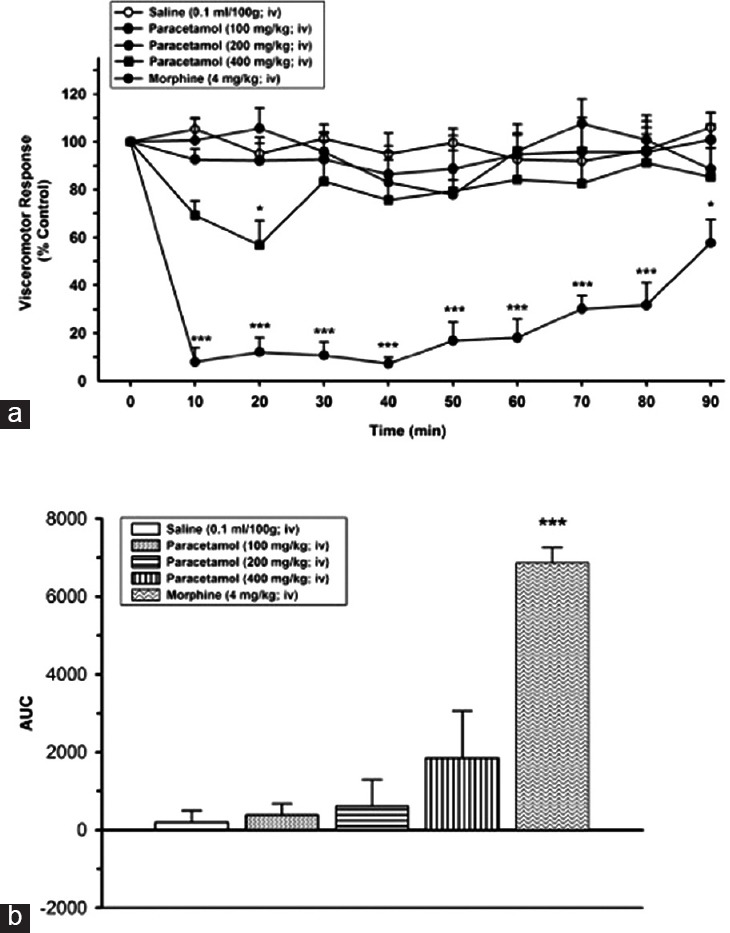
Figure 1.

(a) Effects of paracetamol at the doses of 100 and 200 mg/kg, intravenous, P > 0.05, and at the dose of 400 mg/kg, intravenous, *P < 0.05, on visceromotor response when compared to time point of administration of saline group. (b) Area under the curve values of alteration on visceral response
