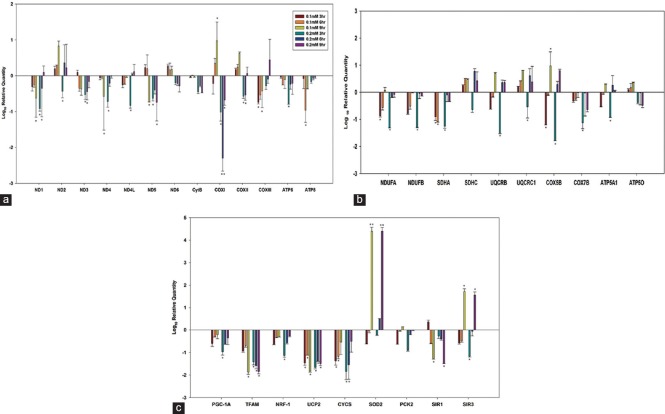
Figure 3.
Gene expression studies with liver cell line demonstrating regulation of the oxidative phosphorylation system, (a) Mitochondrial DNA-encoded oxidative phosphorylation subunits. (b) Nuclear DNA-encoded oxidative phosphorylation subunits. (c) Mitochondrial biogenesis-related transcription factors. Statistically significantly different from other groups *P < 0.05, **P < 0.01

