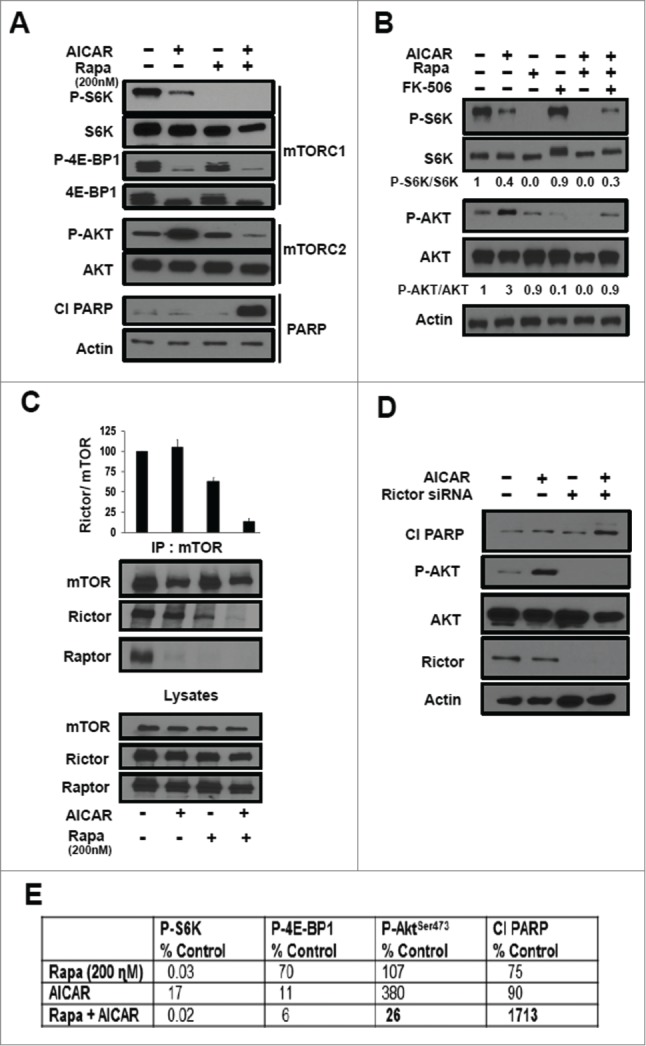
Figure 3.

Apoptotic effects of AICAR and rapamycin is dependent on the suppression of mTORC2 by low dose rapamycin. (A) MDA-MB-231 cells were plated as in Figure 2A. The cells were treated with AICAR (2 mM) and/or rapamycin (200 nM) for 24 hr. The cells were then harvested and levels of the indicated proteins or phospho-proteins were determined by Western blot analysis. (B) MDA-MB-231 cells were plated as in A and were treated with AICAR (2 mM), rapamycin (200 nM), FK-506 (10μM) for 24 h. The cells were then harvested and indicated protein levels were determined by Western blot analysis. The relative levels of S6K and Akt phosphorylation were normalized to total S6K and total Akt respectively, and quantified using LI-COR image studio software. (C) MDA-MB-231 cells were plated and treated with AICAR (2 mM) and/or rapamycin (200 nM) for 24 hr as in A. At this time, lysates were prepared and subjected to immunoprecipitation with anti-mTOR antibody overnight, and then the mTOR immunoprecipitate (IP:mTOR) was subjected, along with the lysates to Western blot analysis for Rictor or Raptor. Because AICAR reduced the levels of mTOR in the immunoprecipitates, we determined the relative protein levels of Rictor normalized to mTOR and quantified using LI-COR image studio software. The data shown are representative of experiments repeated 3 times. Error bars for the graph represent the standard error for an experiment repeated 3 times. (D) MDA-MB-231 cells were plated in 6 well plates at 30% confluence overnight. The cells were then transfected with siRNAs for either scrambled control siRNA, or Rictor as indicated. Six hr later, the cells were treated with fresh medium containing 10% serum for 48hr. AICAR (2 mM) was then added for an additional 24 hr where indicated. The cells were then harvested and the levels of indicated proteins were determined by Western blot analysis. The data shown are representative of experiments repeated at least 2 times. (E) The key data for Figure 3 are summarized in table form where the most critical numbers are in bold highlighting the key effects of the combination of AICAR and rapamycin. Relative levels of phosphorylated proteins were normalized to respective total protein and quantified using LI-COR image studio software. Relative levels of Cl PARP were normalized to actin and quantified. The values were then normalized to controls, which were given a value of 100%.
