Figure 3.

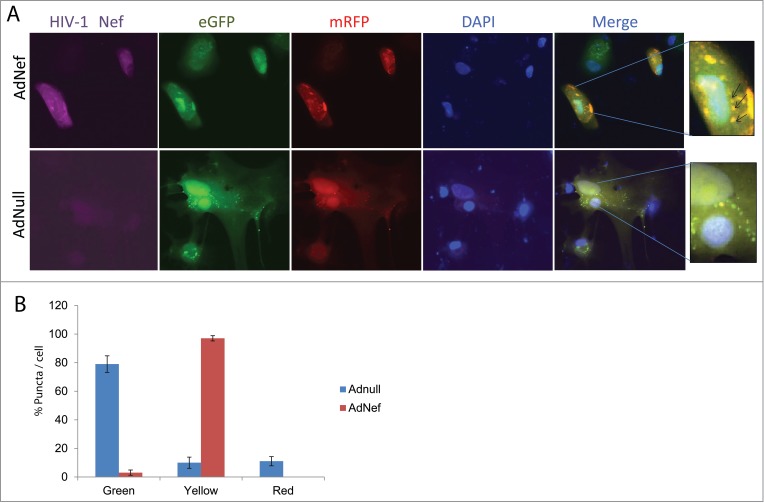
Effect of HIV-1 Nef expression on mRFP-EGFP-LC3 puncta in PHFA cells by Immunocytochemistry (ICC). (A) PHFA cells were plated in 2 well chamber slides the day before the transfection. The cells were first transfected with ptfLC3 plasmid using Lipofectamine™ 3000 according to the manufacturer's guidelines followed by transduction with Ad-null or Ad-Nef and immunocytochemistry was performed as described in Materials and Methods. The upper panel shows the ICC of the Ad-Nef transduced primary astrocytes. From left to right purple for HIV-1 Nef, green for EGFP, red for mRFP, blue for DAPI, and merging EGFP-mRFP-DAPI where puncta were shown. The bottom panel is control with Ad-null transduced PHFA and the slides followed the same order. The far right panels depict the zoom-in where yellow puncta are shown in detail as indicated by arrows. (B) Percentage of Green-red-yellow puncta signal over total puncta per cell in merged images was calculated and shown as a bar graph. Data are shown as mean ± SD and are representative of at least 10 different cells from 10 different fields.
