
Figure 4.
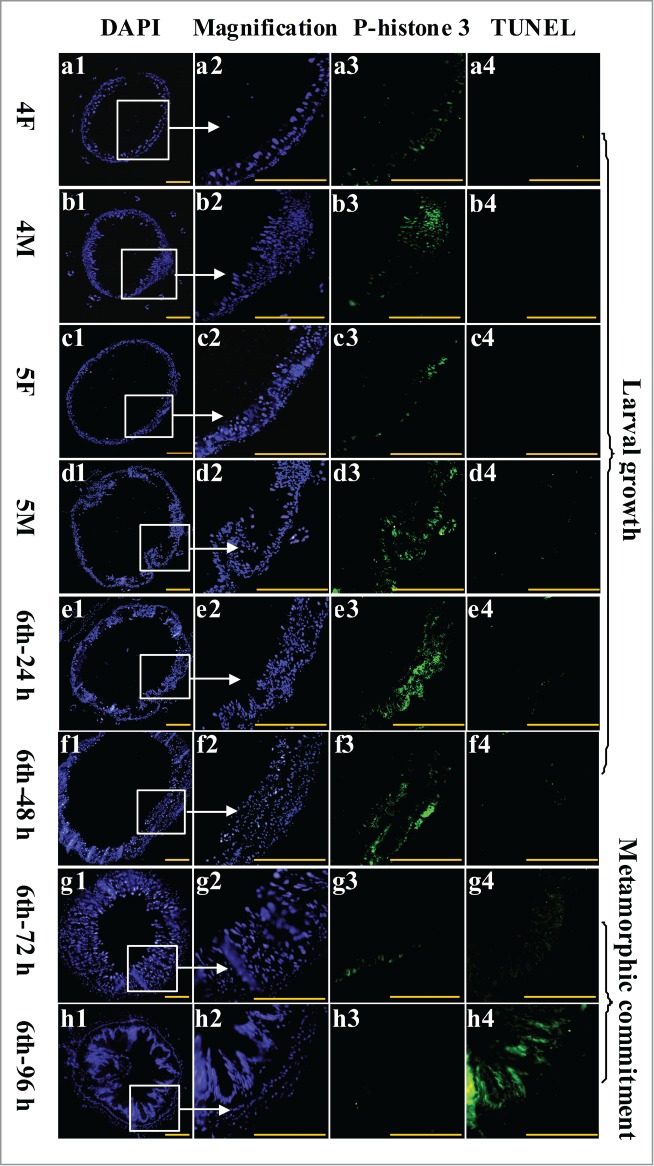
Examination of midgut cell proliferation and PCD from 4th instar to 6th instar based on immunohistochemistry analysis. Panels a1 to h1, DAPI staining showing the nuclei of midgut cells; a2 to h2, magnification of a1 to h1; a3 to h3, phospho-histone 3 detection using the antibody and goat anti-mouse IgG Alexa-Fluor 488 (green) showing cell proliferation; a4 to h4, TUNEL staining showing the midgut PCD. Bar indicates 50 μm.