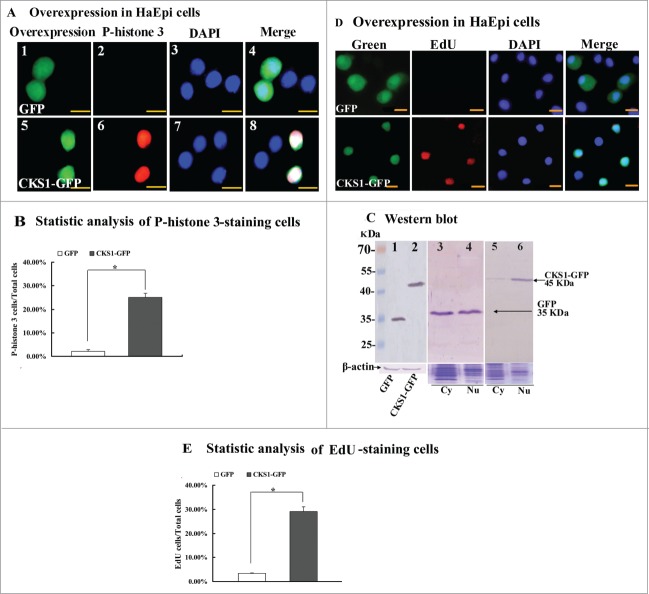
Figure 7.
CKS1 overexpression in HaEpi cells leads to cell proliferation. (A) Detection of cell proliferation by the phospho-histone 3 antibody. Green fluorescence indicates overexpressed GFP or CKS1-GFP, and red fluorescence indicates the phospho-histone 3 detected by the phospho-histone 3 antibody and goat anti-mouse IgG Alexa-Fluor 568 (red). Blue indicates cell nucleus stained by DAPI. Merge is the overlapped red, green and blue. Panels 1 to 4, overexpressed-GFP; panels 5 to 8, overexpressed CKS1-GFP, bar indicates 20 μm; (B) statistic analysis of P-histone 3-staining cells according to the images in Figure S8A. (C) Western blot to confirm the expression and subcellular distribution of GFP and CKS1-GFP with His-taq that were detected by the monoclonal antibody anti-His-tag. Lanes 1 and 2, overexpressed GFP and CKS1-GFP, β-actin was used as the loading control; lanes 3 and 4, subcellular distribution of overexpressed GFP; lanes 5 and 6, subcellular distribution of overexpressed CKS1-GFP. SDS-PAGE gel with commassie Brilliant Blue staining was performed at the same time as loading control to normalize the protein quantity and quality in the cytosal and nucleus. cy: cytoplasm, Nu: nucleus. Bar indicates 20 μm. (D) Detection of cell proliferation by EdU. Green fluorescence indicates overexpressed GFP or CKS1-GFP, and red fluorescence indicates EdU staining; blue indicates cell nucleus stained by DAPI; merge is the overlapped red, green and blue. Bar: 20 μm. (E) Statistic analysis of EdU-staining cells according to the images in Figure S8B. Asterisks indicate significant differences between the groups (P < 0.05) by the student's t test based on 3 independent experiments.

