
Figure 2.
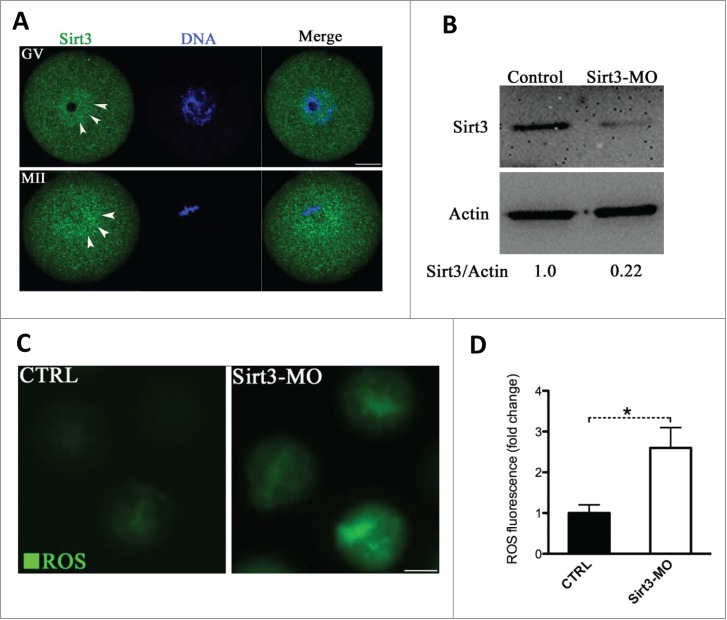
Effects of Sirt3 knockdown on ROS generation in oocytes. (A) Oocytes at GV and metaphase stages were immunolabeled with Sirt3 antibody (green) and counterstained with Hoechst 33342 (blue). Arrowheads point to Sirt3 signals. Scale bar: 20 μm. (B) Extent of knockdown of endogenous Sirt3 protein expression after Sirt3 morpholino (Sirt3-MO) injection was assessed by western blot analysis (100 oocytes were used for each group). Western blot experiments were repeated at least 3 times, with a representative gel image shown. (C) Representative images of CM-H2DCFDA fluorescence in control and Sirt3-MO oocytes. Scale bar: 50 μm. (D) Quantitative analysis of fluorescence intensity shown in C. Error bars indicate ± SD. (In the analysis, n = 120 oocytes for control and 110 for Sirt3 group were included, and pooled from 3 replicates). *P < 0.05 vs control.