
Figure 5.
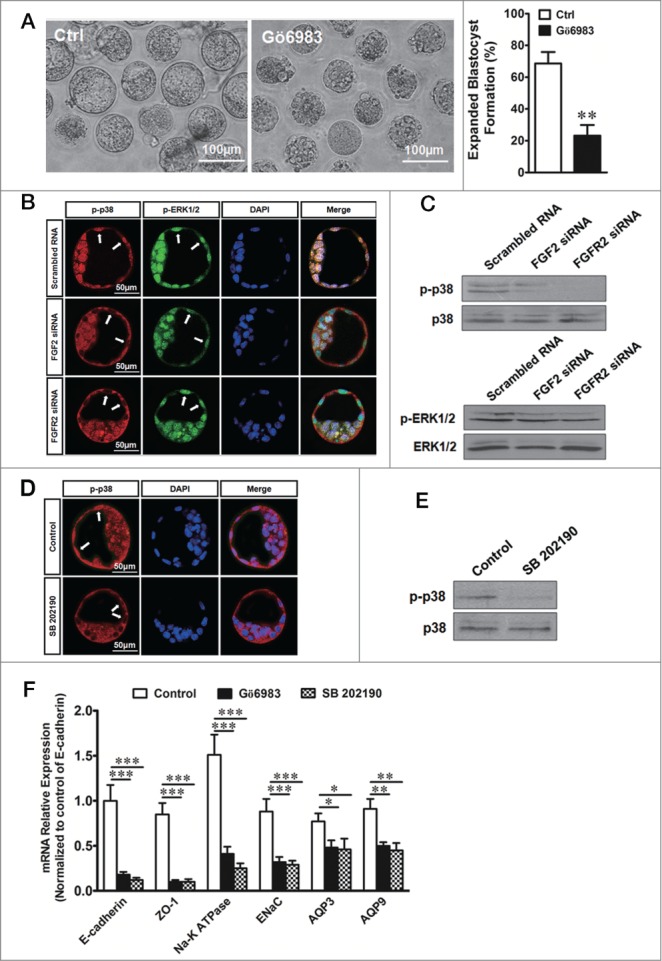
Effect of FGF/FGFR2 on the PKC-p38 pathway during expanded blastocyst formation. (A) Left, effect of the PKC inhibitor Gö6983 (1μM) on expanded blastocyst formation. Scale bar: 100 μm. Right, summary of the results. ** indicates P < 0.01 (by unpaired t-test, n = 5) compared with the control. (B) Effect of FGF2 or FGFR2 knockdown on the nuclear translocation of p-p38 MAPK and p-ERK1/2 MAPK in TEs by confocal double-immunofluorescence. Phenotype as labeled by scrambled RNA (24/30 embryos). Phenotype as labeled by FGF2 siRNA (22/29 embryos). Phenotype as labeled by FGFR2 siRNA (18/24 embryos). Scale bar: 50 μm. (C) Western blots of phosphorylated (p-) p38 (up) or ERK1/2 (down) levels in TEs in response to FGF2 or FGFR2 knockdown with siRNA transfection. (D) Effect of the p38 MAPK inhibitor SB202190 (50 µM) on the nuclear translocation of p-p38 MAPK in TEs by confocal immunofluorescence. The embryos were treated with SB202190 for 10 min. Phenotype as labeled by control (31/35 embryos). Phenotype as labeled by SB202190 treatment (27/32 embryos). Scale bar: 50 μm. (E) Western blots showing p-p38 in response to SB202190 (50 µM). (F) Effect of Gö6983 (1 μM) or SB202190 (50 µM) on the mRNA expression of protein markers of blastocysts in TEs by quantitative real-time PCR. * indicates P < 0.05, ** indicates P < 0.01, and *** indicates P < 0.001 (by one-way ANOVA, n = 4) compared with the corresponding controls.