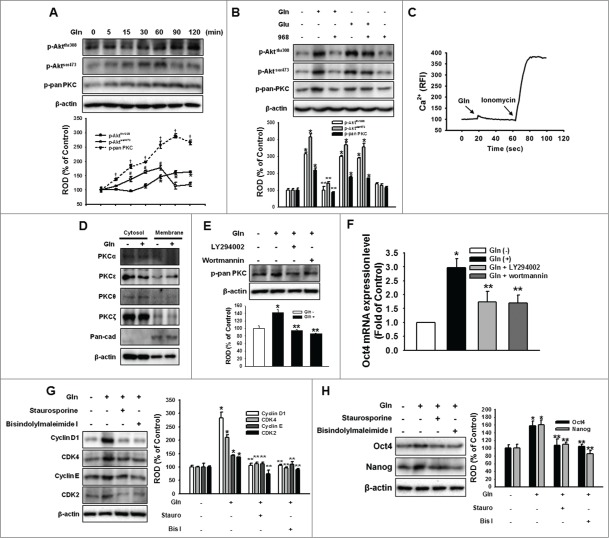
Figure 3.
Involvement of PI3K/Akt and PKC on Gln-induced maintenance of mESC self-renewal. (A) Cells were treated with 4 mM Gln with different time periods (0 to 120 minutes). Akt and pan-PKC phosphorylation was detected by Western blot analysis. The below panels of (A) depicted by line denote mean ± SEM of 3 experiments for each condition determined by densitometry relative to β–actin. *P < 0.05 vs. 0 minute control of p-Aktthr308. #P < 0.05 vs. 0 minute control of p-Aktser473. †P < 0.05 vs. 0 minute control of p-pan PKC. (B) The cells were pretreated with compound 968 for 2 hours prior to incubation with Gln (4 mM) or Glu (4 mM) for 60 min. And Akt and pan-PKC phosphorylation was detected. (C) Cells were loaded with 2 μM Fluo-3AM in serum-free medium for 40 minutes and treated with 4 mM Gln to examine the effects of Gln on intracellular calcium concentration ([Ca2+]i). Ionomycin (Ca2+ ionophore, 1 μM) was used as a positive control in order to validate the assay. The changes in [Ca2+]i were monitored using confocal microscopy and were expressed as relative fluorescence intensities (RFI). (D) Cells were treated with 4 mM Gln for 60 minutes, and cytosolic and membrane fractions were prepared. The PKC α, ε, θ, and ζ isoforms present in either cytosolic or membrane compartments were detected by Western blotting, as previously described. Pan-cadherin (pan-cad) was used as maker of membrane fraction. (E) The cells were pretreated with LY294002 (PI3 kinase inhibitor; 1 μM) and wortmannin (PI3 kinase inhibitor; 1 μM) prior to incubation with 4 mM Gln for 60 min, and pan-PKC phosphorylation was detected. (F) The cell were pretreated with LY294002 and wortmannin for 1 hour and treated with 4 mM Gln for 2 d. The Oct4 gene transcription level was detected. Error bars of (F) represent the mean ± SEM. *P < 0.05 vs. control. **P < 0.05 vs. Gln alone. (G, H) The cell were pretreated with staurosporine (protein kinase C inhibitor; 1 μM) and bisindolylmaleimide I (protein kinase C inhibitor; 1 μM) for 1 hour and treated with 4 mM Gln for 2 d. The cell cycle regulatory proteins, Oct4, and Nanog expression levels were detected. The below or right panels of (B, E, G, H) depicted by bars denote mean ± SEM of 3 experiments for each condition determined by densitometry relative to β–actin. *P < 0.05 vs. control. **P < 0.05 vs. Gln alone.

