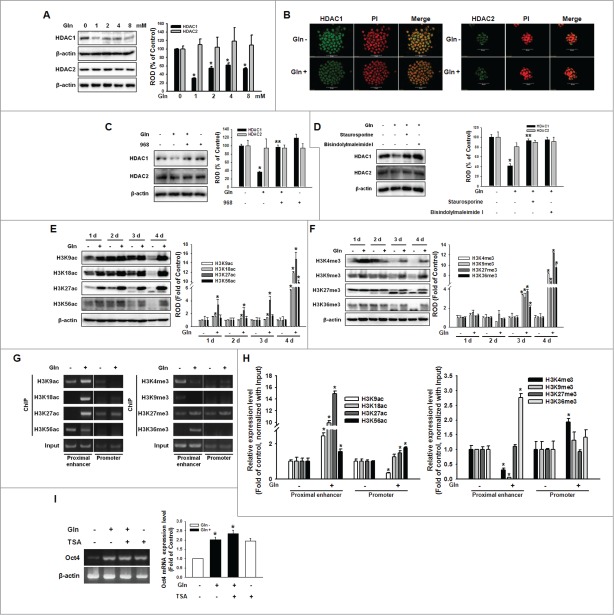
Figure 5.
Involvement of HDAC on Gln-induced histone modification. (A) Cells were treated with various concentration of Gln (0–8 mM), and HDAC1 and HDAC2 expression level were detected with Western blot analysis. The right panel depicted by bars denotes mean ± SEM of 3 experiments for each condition determined by densitometry relative to β–actin. *P < 0.05 vs. control (0 mM of Gln). (B) The cells were incubated with Gln for 2 d, and were double labeled with anti-HDAC1, -HDAC2, and PtdIns and observed with a confocal microscope. (C, D) The mESCs were pretreated with compound 968, staurosporine, or bisindolylmaleimide I prior to Gln treatment, and HDAC1 and HDAC2 expression level were detected. The right panels of (C and D) depicted by bars denote mean ± SEM of 3 experiments for each condition determined by densitometry relative to β–actin. *P < 0.05 vs. control. **P < 0.05 vs. Gln alone. (E, F) Cells were cultured with/without Gln for 1–4 d. And histone acetylation and methylation level were detected. The right panels of (E and F) depicted by bars denote mean ± SEM of 3 experiments for each condition determined by densitometry relative to β–actin. *P < 0.05 vs. Gln deprivation group of each days. (G, H) Cells were incubated with/without Gln for 2 d, and the chromatin DNA was immunoprecipitated with antibodies against histone acetylation and methylation, the resulting samples were amplified with the primers for proximal enhancer and promoter of Oct4 gene. And then, the PCR products were verified by running on a 2% agarose gel or were analyzed with real-time PCR. (I) Cells were pretreated with TSA (trichostatin A; 100 nM) for 12 hours prior to incubation with Gln for 2 d, and Oct4 mRNA levels were detected. Error bars represent the mean ± SEM. *P < 0.05 vs. control. **P < 0.05 vs. Gln alone.

