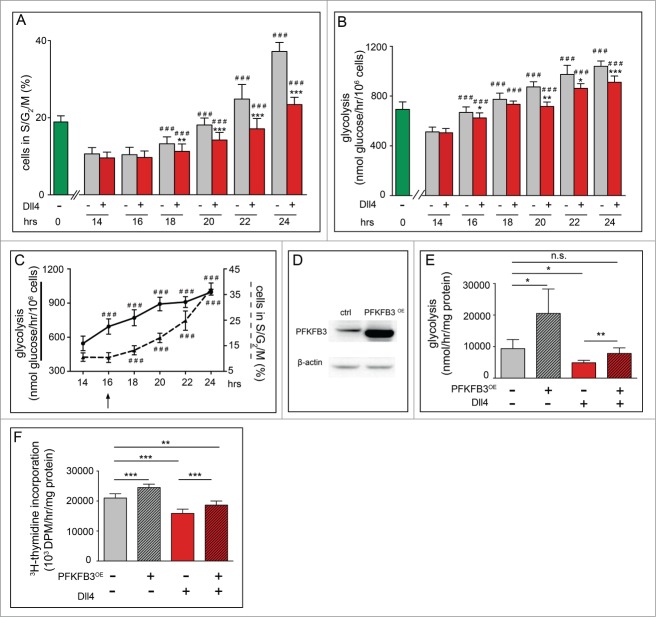
Figure 3.
Notch is a metabolic brake for G1 cell cycling in ECs and overexpression of PFKFB3 overcomes the Notch-mediated metabolic brake. For all panels, G0-synchronized ECs (obtained by contact inhibition) were replated and analyzed at the indicated time points. (A) Time course FACS analysis using Hoechst33342 and PyroninY in control (gray) and Dll4-treated ECs (red). Around 18 hours after reseeding, control cells entered S phase. By contrast, fewer Dll4-treated cells entered S phase (average of >10 experiments, each with triplicate measurements; data are mean ± SEM). ** P < 0.01, *** P < 0.001 versus control at the corresponding time point; ### P < 0.001 vs. corresponding baseline (14 hours). Statistics: mixed model statistics considering experiment as co-variant. (B) Time course analysis of glycolytic flux. Around 16 hours after reseeding and beyond, glycolytic flux was increased in control cells but only minimally in Dll4-treated cells (average of 5 experiments, each with triplicate measurements; data are mean ± SEM). * P < 0.05, ** P < 0.01, *** P < 0.001 versus control at the corresponding time point; ### P < 0.001 vs. corresponding baseline (14 hrs); Statistics: mixed model statistics considering experiment as co-variant. (C) Kinetic comparison of metabolic and cell cycle changes after replating of the G0-synchronized cells. Plotting the control data shown in panel A and B together illustrates that the metabolic change (full line) shows an increase preceding (16 hrs, arrow) that of the cell cycle change (dashed line) (average of 5 experiments, each with triplicate measurements; data are mean ± SEM). ### P < 0.001 versus corresponding baseline (14 hrs); Statistics: mixed model statistics considering experiment as co-variant. (D) Representative immunoblot of PFKFB3 for control and PFKFB3OE cells. β-actin is used as loading control. (E) Glycolytic flux, showing enhanced glycolysis upon PFKFB3 overexpression (PFKFB3OE) in control conditions (without Dll4). Dll4 lowers glycolysis, but PFKFB3OE enhances glycolysis again in Dll4-activated cells. (F) [3H]-thymidine incorporation in DNA, showing that PFKFB3OE increases EC proliferation. Dll4 reduces EC proliferation, but PFKFB3OE increases again the proliferation of Dll4-activated ECs. Data in E and F are mean ± SEM of n = 4 independent experiments, each performed in triplicate. *P < 0.05, **P < 0.01, ***P < 0.001 by mixed model statistics considering experiment as co-variant.

