
Figure 2.
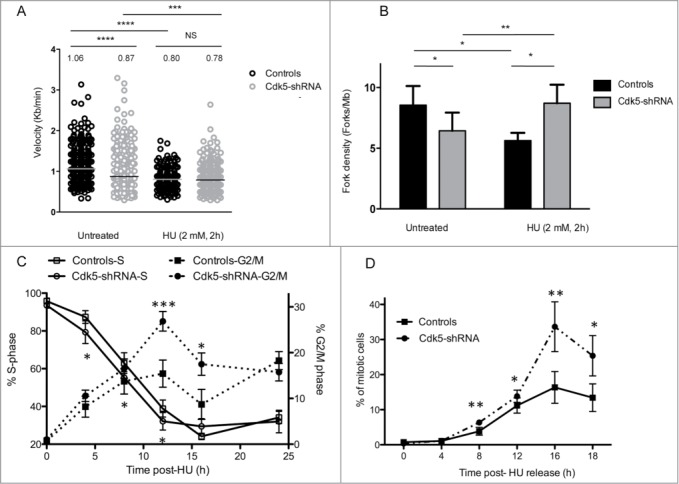
Cdk5-shRNA cells show a faster progression through S and G2 after exposure to HU. (A) Replication fork speed distribution in Control and Cdk5-shRNA cells in treated (HU 2mM, 2 h) or untreated cells. 100 to 250 DNA fibers were scored per condition. The numbers correspond to the median (shown as a horizontal line) replication speed. P values are indicated (NS - not significant; *P < 0.05; **P < 0.01; ***P < 0.001; ****P <0.0001, Mann-Withney test). Data are based on 2 independent experiments for each Cdk5-shRNA clone, mean values of the 4 experiments have been calculated. (B) Increased fork density in Cdk5-shRNA cells after HU (2 mM, 2 h) treatment: Control and Cdk5-shRNA cell lines were treated or not, then labeled with successive pulses of IdU and CldU for 30 min each. Fork density was determined as the number of forks per Mb in the S-phase DNA population. More than 100 Mb was measured per condition. Data are the combined means ± SD from 2 independent experiments for each Cdk5 clone, mean values of the 4 experiments have been calculated. (C) Cells were treated with HU (2 mM) for 24 h, released into fresh medium (0 h corresponds to 24 h HU treatment) then pulse labeled with BrdU (10 µM, 15 min) at different times post release before collection and the percentage of Controls and Cdk5-shRNA cells in S and G2/M phases were determined by FACS analysis. Data are means ± SD from 3 independent experiments for 2 different HeLa Cdk5 clones. (*P < 0.05; **P < 0.01; ***P < 0.001; Unpaired t-test). (D) Mitotic entry after HU release. Control and Cdk5 cells were treated with 2 mM HU for 24 h and released into medium containing Nocodazole (50 µg/µl). The percentage of mitotic cells was analyzed by FACS by phospho-H3 content. Data are means ± SD from 2 independent experiments for 2 different HeLa Cdk5 clones. (*P < 0.05; **P < 0.01; ***P < 0.001; Unpaired t-test).