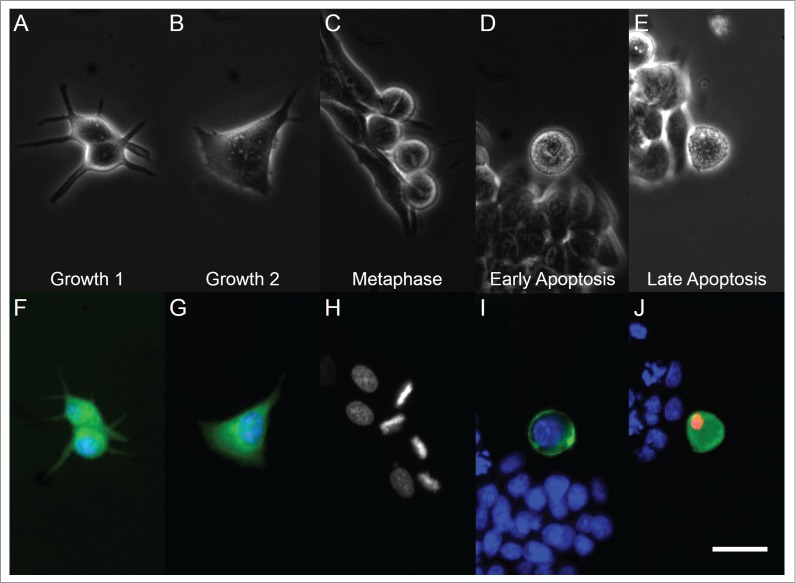
Figure 1.

Light microscopy (top row) and fluorescent microscopy (bottom row) images of cells in different phases of the cell cycle and apoptosis. From left to right, panels correspond to G1, G2, metaphase, early apoptotic, and late apoptotic cells. Panel (H) has retained grayscale coloring for easier visualization of chromosome alignment on a dark background. White bar indicates 20 µm.
