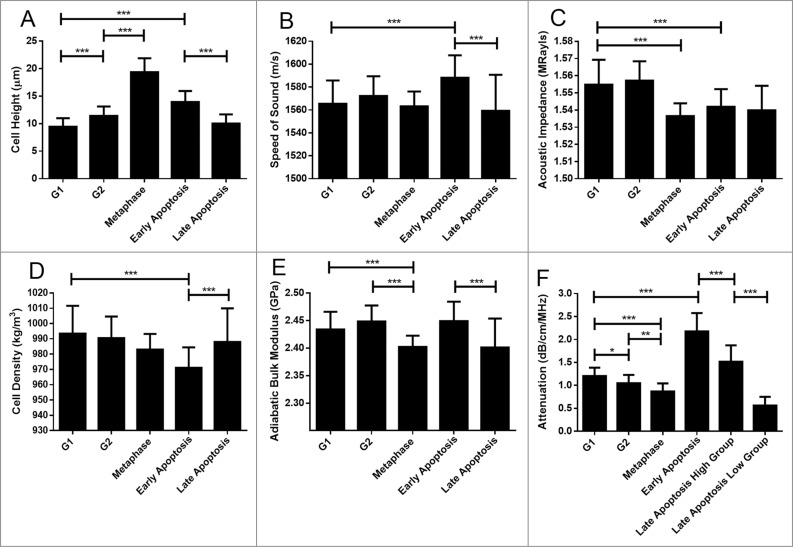
Figure 2.
Cell properties as a function of cell state. Error bars represent standard deviations of 58 measurements. Black lines over top of the data represent comparison between groups, with the number of asterisks corresponding to a significance of difference. * p ≤ 0.05; ** p ≤ 0.01; *** p ≤ 0.001. 58 cells were measured for each property.

