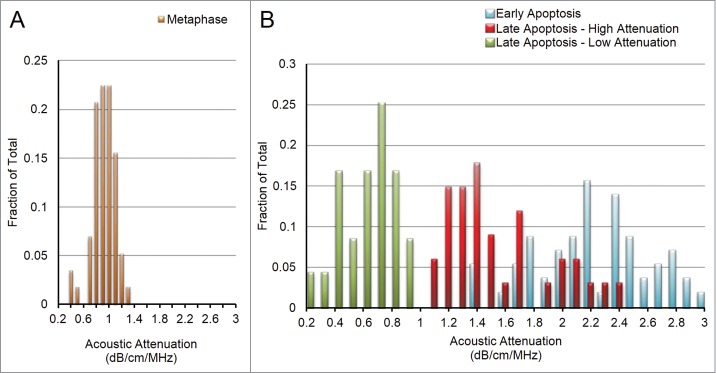
Figure 3.

(A) With a single exception, all properties for all cell groups displayed approximate Gaussian curves, as above for attenuation in metaphase cells. (B) Attenuation for late apoptotic cells displayed a double-bell shaped distribution, indicating the existence of a “lower attenuation” subgroup (green) and a “higher attenuation” subgroup (blue). Early apoptotic histogram is seen in red to for easier visualization of the decrease in attenuation values as cells progress through apoptosis.
