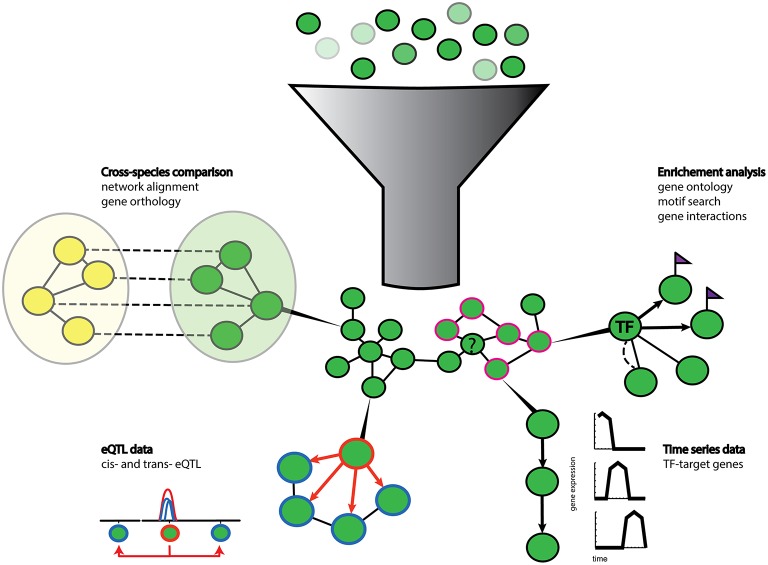
Figure 2.
Schematic representation of gene prioritization strategies. Gene sets of different expression values (shades of green) are used for co-expression network inference. Genes with co-expression values above a user defined threshold (dark green nodes) form nodes and edges in the network. Various additional data can then be used to enrich and extract biological relevant information from the network. Enrichment analysis tools such as gene ontology terms (pink contour nodes) can be used to functionally annotate unknown genes (question marked node) clustered in the vicinity. Prior knowledge can also help to highlight known gene-gene interactions (dotted line) and cis-regulatory motif (purple flags) can suggest local regulatory interactions (arrows) between transcription factors (TF node) and their target genes (flagged nodes). Gene regulatory relationships can also be extracted from time series data. Algorithms can extract causal regulatory relationships from shifted gene expression patterns in time series data. Co-localization of trans- and cis-eQTLs (hotspots) can also infer regulatory relationships between genes with a cis-eQTL (orange contour node) and genes with trans-eQTLs (blue contour node). Additional information can be gained from comparisons with networks of other species (yellow nodes) by orthology and network alignment (dotted lines).

