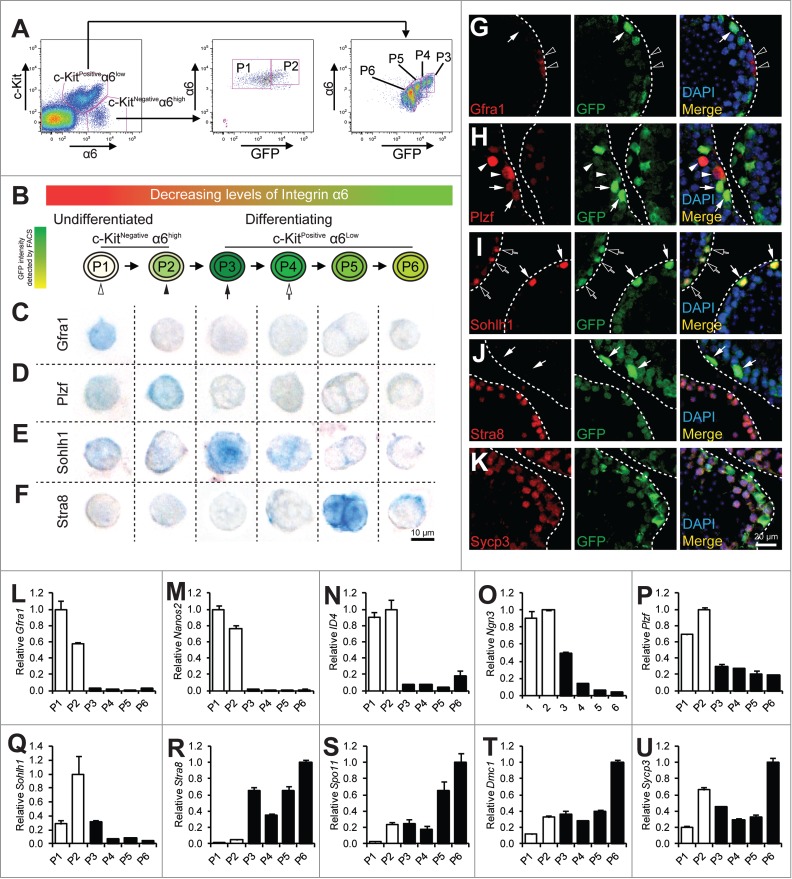
Figure 1.

Analysis of spermatogonial differentiation by flow cytometry. (A) representative flow profile of separating spermatogonia differentiation into P1 to P6 by using a combination of markers for undifferentiated SSC (α6-integin), differentiating spermatogonia (c-Kit), and GFP driven by the Stra8 promoter. Note the concomitant decrease of α6-integrin level with GFP in the c-KitPos α6-integrinlow population. (B) schematic diagram showing progression of spermatogonial development from P1 to P6. C–F, immunohistochemistry staining of cells from P1 to P6 populations isolated from 4-weeks old juvenile pStra8-GFP mice. Expression of Gfra1 (C), Plzf (D), Sohlh1 (E), and Stra8 (F) was detected by alkaline phosphatase (AP). Cells shown are magnified views of a single cell. G–K, dual-immunofluorescence staining of GFP (green) with Gfra1 (G), Plzf (H), Sohlh1 (I), Stra8 (J), and Sycp3 (K) (red) in 4-weeks old juvenile mouse testes. L–U, qPCR analysis of relative mRNA expression of the indicated genes in P1 to P6. Twenty,000 cells were isolated from 4-weeks old juvenile pStra8-GFP mice by FACS as shown in panel A. mRNA levels are normalized to those of β-actin. Data are representative of 3 independent set of experiment. Graphs represent mean ± standard deviations from duplicate reactions.
