Figure 2.
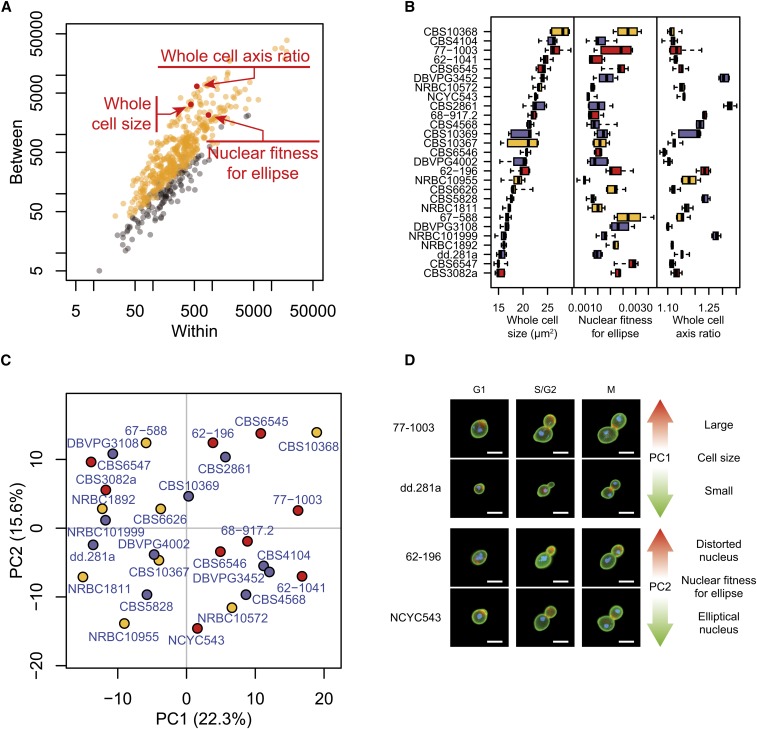
Morphological parameter variation within the L. kluyveri species. (A) Intra- vs. interstrain variability of morphological traits. Each dot represents one of 501 measured parameters. Orange and gray distinguish the traits that were called significant and nonsignificant by the Kruskal-Wallis test at P < 0.05 after Bonferroni correction, respectively. For the purpose of visual clarity, each parameter was transformed by f(x) = (x − μCBS10367) / σCBS10367, where μCBS10367 and σCBS10367 are the mean and standard deviation of the parameter across five replicates of the CBS10367 strain. Note that significance inference was determined from ranks of raw values and was therefore not affected by this transformation. The sum of squares across replicates (x-axis) and across strains (y-axis) was then computed. The three parameters highlighted in red reflect distinct cellular properties: whole cell size of the G1 cell, nuclear fitness for ellipse of the S/G2 cell, and long over short axis ratio of the ellipse fitted to the G1 cell. (B) Boxplot representation of these morphological parameters calculated for the 27 L. kluyveri strains. Box colors represent geographical origins with red for America, blue for Europe, and yellow for Asia. (C) Principal component (PC) analysis of L. kluyveri morphological variation. Strains are represented by their coordinates along the first two principal components, using the same colors as in Figure 2B. (D) Representative cells illustrating the traits contributing to the first two principal components. Bar: 5 μm.

