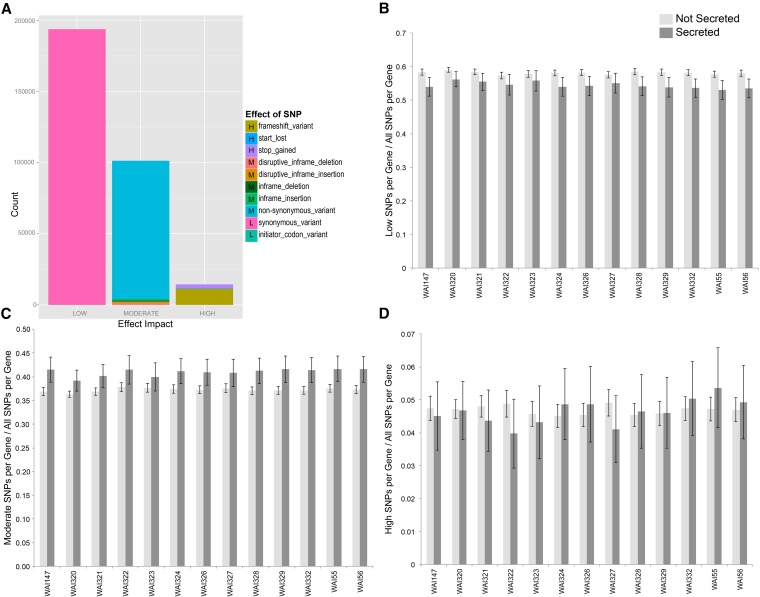
Figure 1.
Summary of all single effect SNPs identified in the 13 sequenced genomes using IPO323 as a reference sequence. (A) The number of identified SNPs, colored by their effect on the genome and separated into “Low”, “Moderate,” and “High” effect categories, dependent upon their effect on coding regions. (B) The number of low effect SNPs found within nonsecreted and secreted genes as a percentage of all identified SNPs. The light gray bars show that, on average, Low effect SNPs are found at a higher proportion in nonsecreted genes vs. secreted. Black error bars show 95% confidence intervals (CI), from all genes. (C) The number of moderate effect SNPs found within nonsecreted and secreted genes as a percentage of all identified SNPs within a gene. Higher dark gray bars show that, on average, Moderate effect SNPs represent a higher proportion of identified SNPs in secreted genes. (D) There is no observed trend for High effect SNPs in secreted vs. nonsecreted genes.

