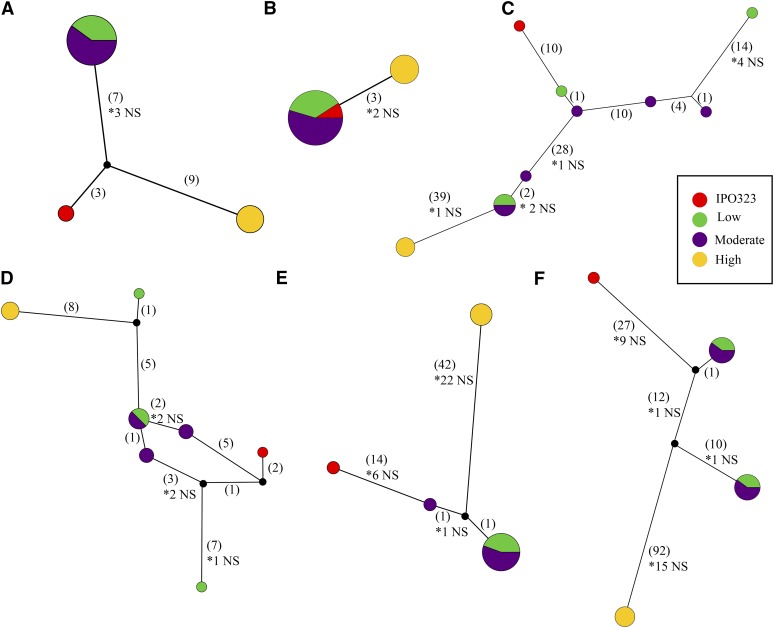
Figure 4.
Haplotype networks for six secreted genes identified with PhyBi. Maximum parsimony networks generated with TCS v1.21 and drawn with popart (http://popart.otago.ac.nz). Networks are not drawn to scale and indels were treated as missing data. Single point mutations are shown in parenthesis with the number of nonsynonymous mutations shown with an asterisk below. Haplotype circles are proportional to the number of isolates identified and colored based on their virulence grouping in Figure 3. Black dots are probable unsampled haplotypes as identified by TCS. (A) ZtRRes_00659, (B) ZtRRes_01714, (C) ZtRRes_05182, (D) ZtRRes_06114, (D) ZtRRes_08426, (F) ZtRRes_08778.

