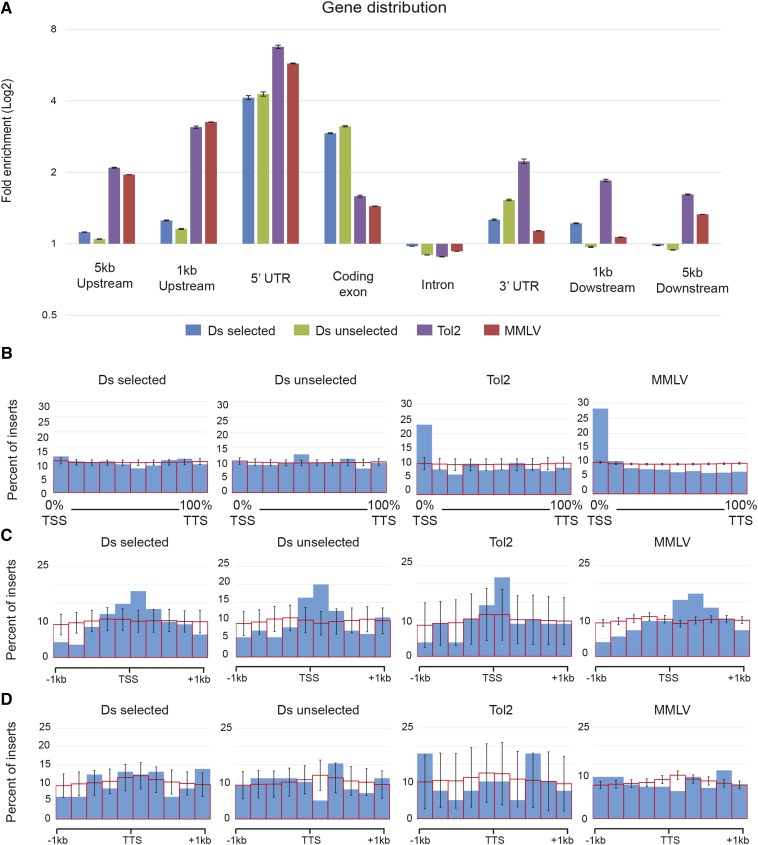
Figure 4.
Distribution of integration sites across gene regions. (A) Fold enrichment values for various gene subregions. Average enrichment ± standard error (n = 1000). Ds integrations show preference for coding and 5′ gene regions. Tol2 and MMLV (Moloney Murine Leukemia Virus) integrations show preference for 5′ regions of genes. (B) Ds integrations are distributed uniformly across the length of gene regions, while Tol2 and MMLV are enriched toward the first 10% of genes. (C) Ds, Tol2, and MMLV show enrichment close to transcription start site (TSS), but are not enriched around the transcription termination site (TTS) (D). Solid blue bars represent integration sites. Open red bars represent average of 1000 matched controls ± standard deviation.

