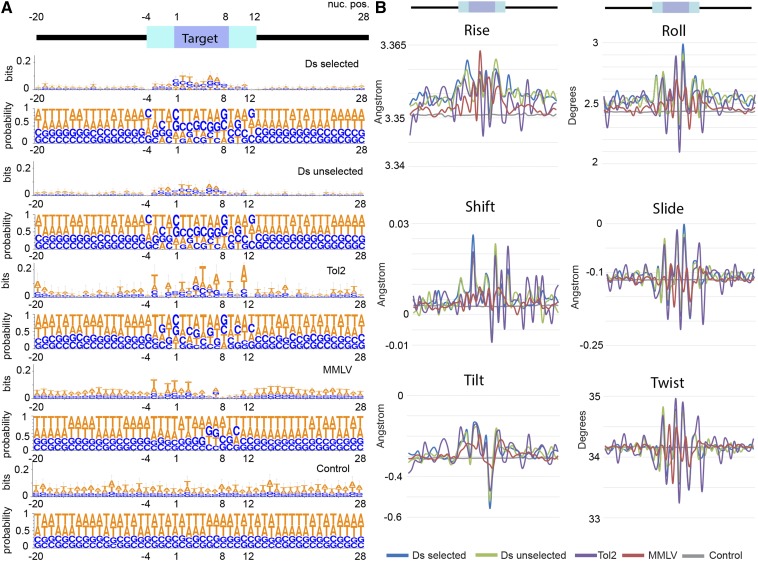
Figure 5.
Target sites show structural features even in the absence of a strict motif. (A) Graphical representations of nucleic acid multiple sequence alignment were generated with WebLogo v3.4 (Crooks et al. 2004). Ds and Tol2 integrations show weak preference for specific nucleotides at the integration site. Numbers on top indicate nucleotide position around the integration site shown on the x-axis. Information measured in bits and probability is shown on the y-axis. (B) Average values of protein-DNA movement for each position in the multiple sequence alignment plotted according to their values. Numbers on top indicate position around the integration site shown on the x-axis. Red lines represent integration site data. Blue lines denote the average of matched controls (n = 1000). MMLV, Moloney Murine Leukemia Virus.

