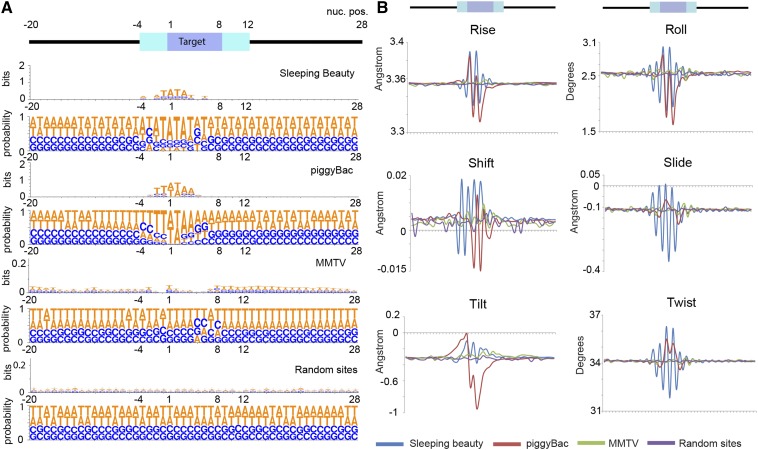
Figure 7.
Measures of DNA flexibility show similar features in transposon and retroviral integration sites in mouse cells. (A) Sequence logo for various integrations in mouse cells show an obvious common motif. Numbers on top indicate position around the integration site shown on the x-axis. Information measured in bits and probability shown on y-axis. (B) Structural features of DNA at integration sites. Average DNA flexibility values shown in y-axes. Nucleotide position shown on x-axis. MMTV, Mouse Mammary Tumor Virus.

