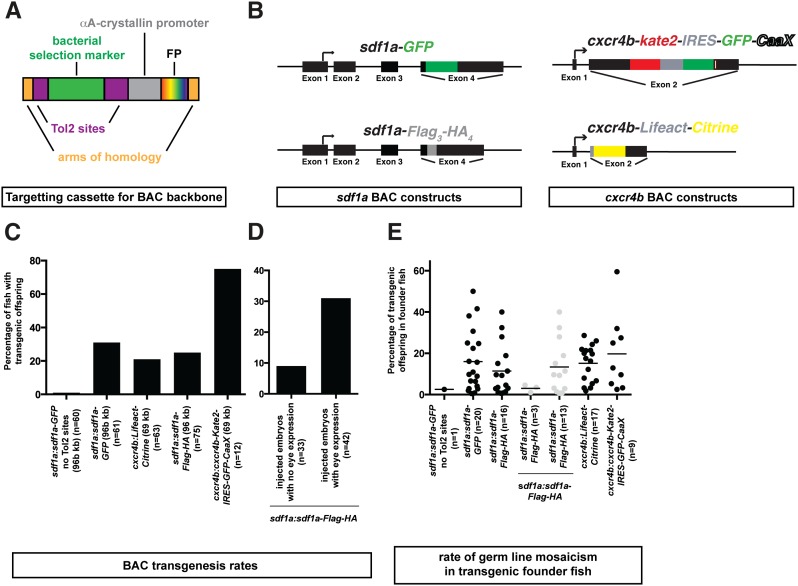
Figure 1.
Transgenic constructs and tol2-mediated transgenesis rates for BACs. (A) Schematic representation of BAC backbone targeting cassettes containing arms of homology for the BAC backbone (orange), a selection marker (green) flanked by Tol2 sites (purple), followed by the cryaa promoter (gray) driving a fluorescent protein (rainbow) in the lens of the eye (see Table 1). (B) Schematic representation of the BAC transgenes. Note that cxcr4b-GFP-IRES-Kate2-CaaX is not shown. (C) Rates of transgenesis for the BAC transgenes depicted in B. The size of the transgenes and the number of fish screened (n) are indicated. (D) Transgenesis rate of embryos injected with the sdf1a:sdf1a-Flag3-HA4 transgene, and presorted for mosaic fluorescent protein expression in the lens compared to injected embryos without mosaic fluorescent protein expression in the lens. The overall rate of transgenesis for the sdf1a:sdf1a-Flag3-HA4 transgene is indicated in C. (E) Rate of germline mosaicism in the transgenic founder fish for the transgenes indicated in B. Dots represent the rate of germline mosaicism in individual fish and the horizontal line indicates the median.

