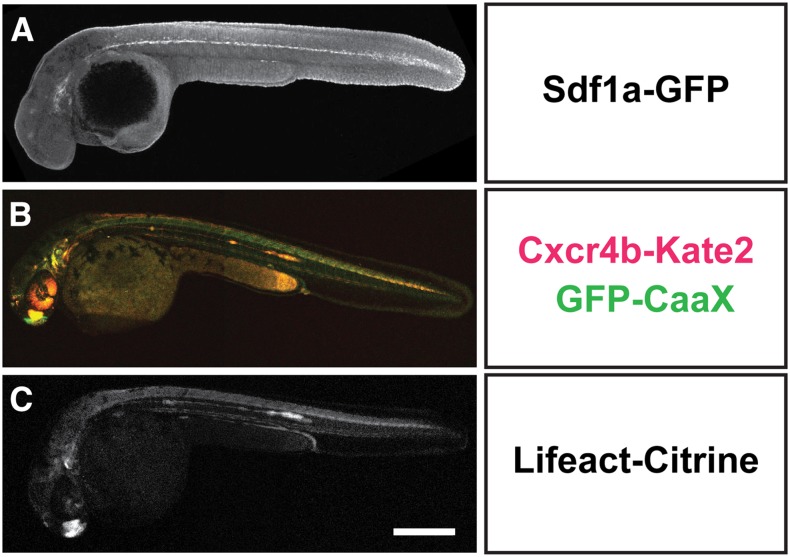
Figure 2.
BAC transgenes faithfully recapitulate endogenous expression patterns. Overview images of embryos expressing sdf1a:sdf1a-GFP. (A) Stained embryo at 30 hours postfertilization (hpf), (B) cxcr4b:cxcr4b-Kate2-IRES-GFP-CaaX (live 36-hpf embryo), and (C) cxcr4b:Lifeact-Citrine (live 36-hpf embryo). Images are maximum (A) or sum intensity (B and C) projections of z-stacks. Scale bar corresponds to 300 μm.

