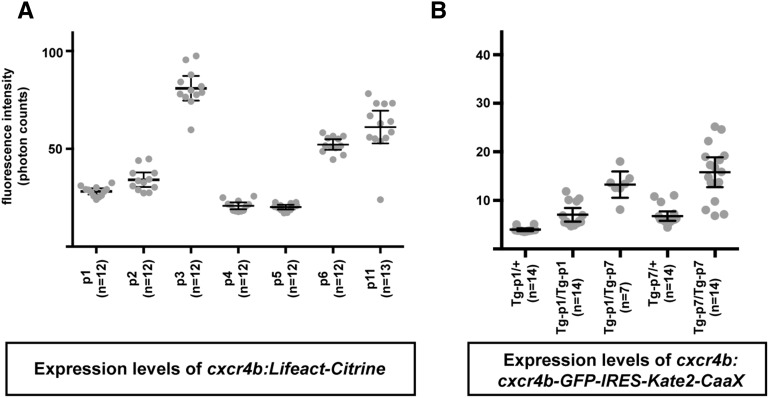
Figure 3.
Integration site effects on BAC transgene expression levels. Quantification of the average citrine (A) and Kate2 (B) fluorescence within the posterior lateral line primordium at 36 hpf for the cxcr4b:Lifeact-Citrine and cxcr4b:cxcr4b-GFP-IRES-Kate2-CaaX transgenes in different transgenic lines. Expression levels vary about three- to four-fold among the different transgenic lines for both BAC transgenes, likely reflecting effects of the integration site on expression levels. Individual measurements of the average fluorescence intensity within the posterior lateral line primordium are indicated by gray dots. Horizontal lines indicate the average fluorescence intensity of the different transgenic lines, and error bars indicate the 95% confidence interval.

