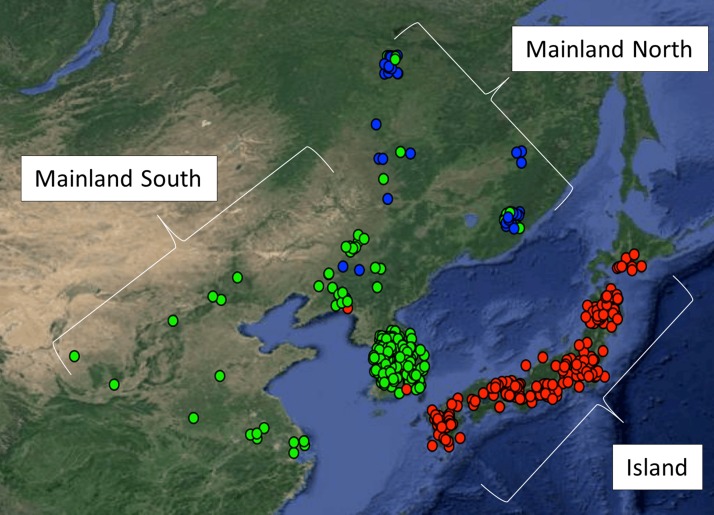
Figure 1.
Results of STRUCTURE analysis in G. soja accessions, and the geographical location in which each were collected. The spot colors correspond to the STRUCTURE assignment of each accession, Green: Mainland South; Blue: Mainland North; Red: Island. The assignment of samples into three genetic clusters generally accords with geography. The spots have been jittered to show overlapping samples.

