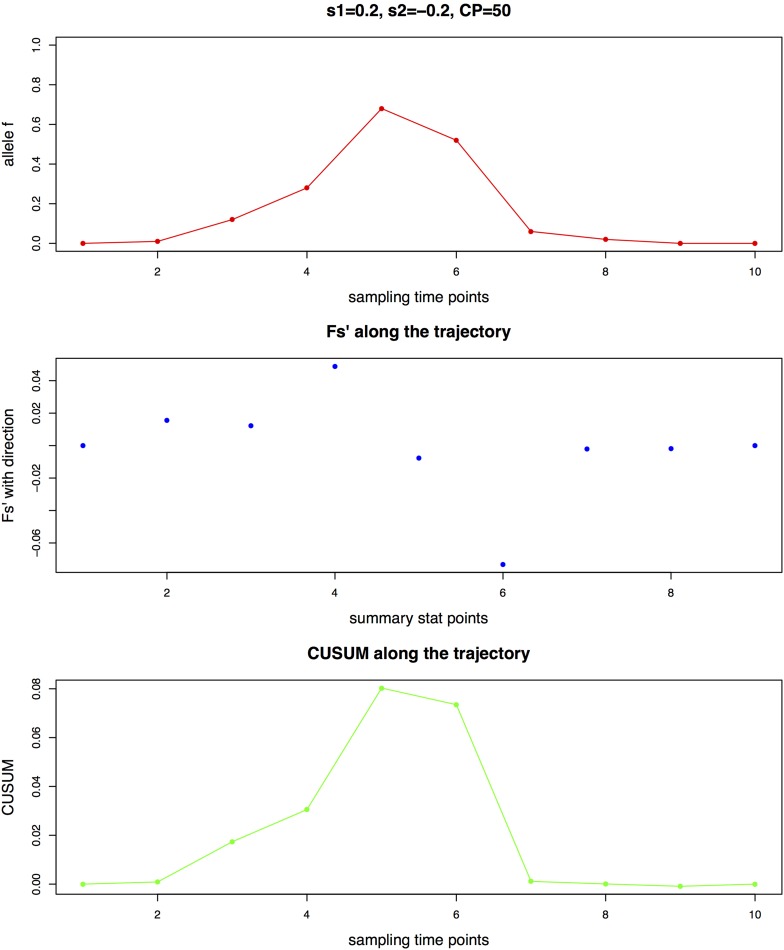
Figure 1.
Illustration of Fs’ calculated between every pair of consecutive sampling time points with 10 generations and the maximal CUSUM (cumulative sum control chart) value SCP as summary statistics, using a haploid population of Ne = 1000 with a de novo mutation and the sample size as 100. (A) Allele frequency trajectory (B) Fs’ values along the trajectory (C) CUSUM values along the trajectory

