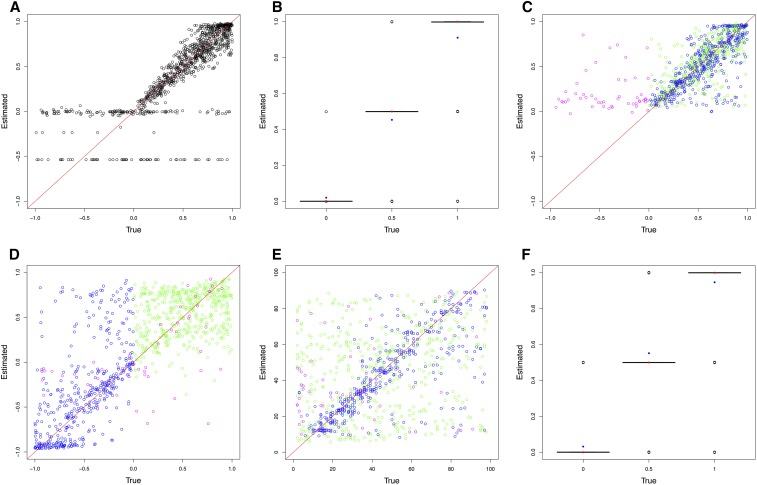
Figure 4.
ABC (approximate Bayesian computation) model choice parameter estimations for 1000 pseudoobservables with a diploid population of Ne = 500. For cross-validation graphs, each circle is the mode of the posterior distribution from the 0.1% best simulations. For boxplots, red dots are true values and blue dots are average estimated values. Case 1: pseudoobservables with constant selection (A) M0 estimates of s and (B) M0 estimates of h. Case 2: pseudoobservables with changing selection (C) M1 estimates of s1, (D) M1 estimates of s2, (E) M1 estimates of CP, and (F) M1 estimates of h (green: positive s1 to positive s2, blue: positive s1 to negative s2, magenta: other cases)

