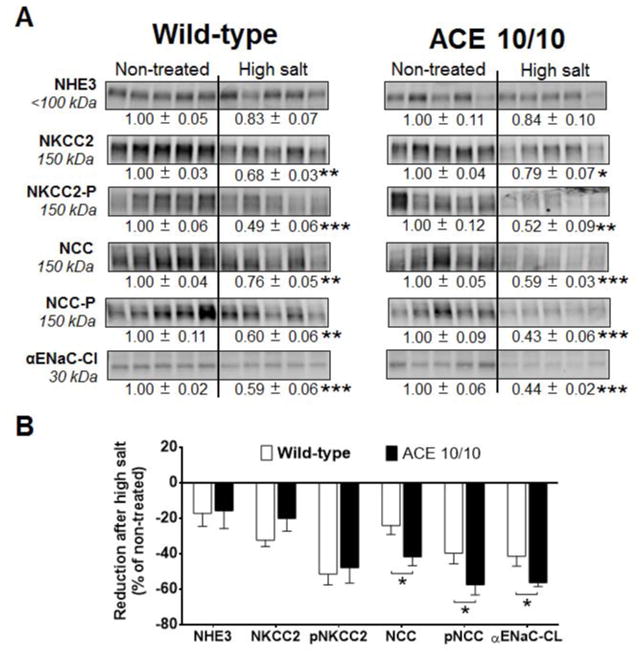
Figure 7. The absence of renal ACE amplifies reductions in abundance and/or phosphorylation of NCC and the cleaved (CL) portion of αENaC after 3 weeks of a high salt diet.

(A) Transporter expression was analyzed in total kidney homogenates from non-treated mice and after a 3-week high salt phase. L-NAME was given to wild-type (0.5 mg/mL) and mutant mice (1.5 mg/mL) in the drinking water. Immunoblots were performed with a constant amount of protein per lane. Relative abundance from each group is displayed below the corresponding blot as mean ± SEM. n = 12 per group, *p<0.05; **p<0.01; ***p<0.001 vs. corresponding non-treated mice. (B) Bars represent the relative reduction vs. non-treated mice (set as 0), *p<0.05; **p<0.01; ***p<0.001.
