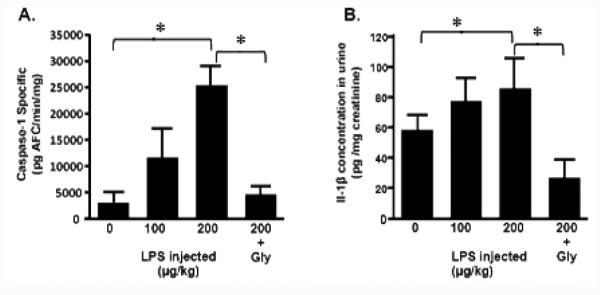
Figure 2.

Caspase-1 activity (urothelia) and IL-1β levels (urine) at the end of the dosing regimen. Rats injected with 0, 100 or 200 μg/kg LPS were given vehicle (p.o.) at the times outlined in Figure 1 while the animals in the 200 + Gly group were given 10 mg/kg glyburide. 0 μg/kg LPS is the equivalent to the vehicle-treated, saline-injected rats presented in other figures. 24 h after bladder wall injection rats were sacrificed, urothelia isolated and caspase-1 activity assessed as described. A. Caspase-1 activity in the urothelia. Bars represent the mean ± SEM; n=3 for 0, 100, and 200+gly samples, n=5 for the 200 μg/kg sample. Asterisks indicated significant differences (P<0.05) between the indicated bars. B. IL-1β levels in the urine. Bars represent the mean ± SEM; n=3 for all groups. Asterisks indicated significant differences (P<0.05) between the indicated bars.
