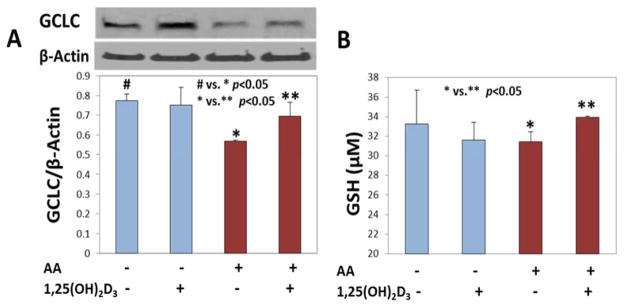
Figure 3. Effect of 1,25(OH)2D3 supplementation on increases in glutathione levels.
Panel A shows the expression of GCLC in AA treated and 1,25(OH)2VD supplemented HUVEC. The bar graph in panel B shows the cellular levels of GSH. The difference between # (untreated control cells) vs. * (AA treated cells) is significant at a p value <0.05 in panel A. The difference between * (AA treated cells) vs. ** (AA+1,25(OH)2VD treated cells) is significant at a p value <0.05. Values are mean±SE (n=3).

