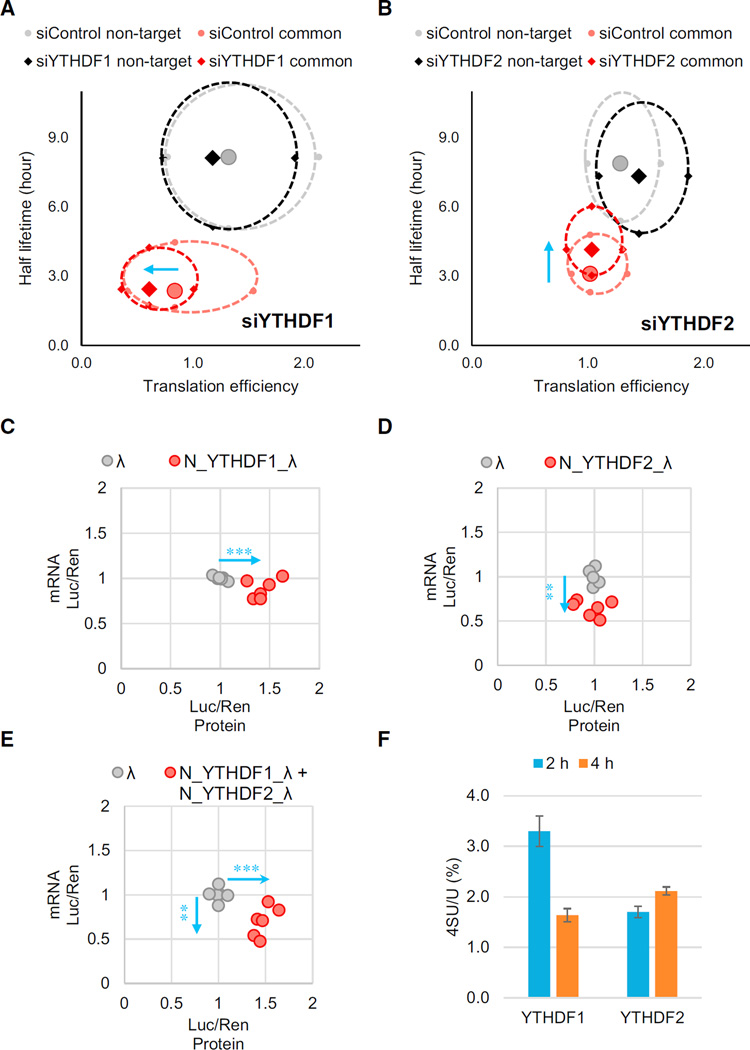
Figure 6. Translation Efficiency of the Common mRNA Targets of YTHDF1 and YTHDF2 is Affected by Both m6A Readers.
(A and B) Evaluations of translation efficiency and mRNA half-lifetimes of shared targets or non-targets of YTHDF1 and YTHDF2 with and without perturbation. Ribosome profiling and mRNA-seq data were collected under YTHDF1 knockdown (A) or YTHDF2 knockdown (B) conditions. Transcripts were categorized into common targets of YTHDF1 and YTHDF2 (red) or non-targets (black) under the knockdown conditions, and each compared with their corresponding control (pink and gray, respectively). The solid diamonds and circles represent median of the translation efficiency and half-lifetime. The four periphery dots surrounding each median are data quartiles (25% and 75% of each variance) and connected by dashed lines. The blue arrows denote the directions of changes compared to the control.
(C–E) Evaluations of both mRNA abundance and protein production of the reporter transcripts using the tethering assay. Cells transfected with inducible luciferase genes were tethered by YTHDF1 (C), YTHDF2 (D), or both (E). Protein production was calculated by normalized luciferase signal (F-luc/R-luc). mRNA abundance was quantified by qRTPCR with normalization. Data points representing the tethered group (red dots) were compared to those of the control group (tethered with control λ peptide, gray dots), and the directions of changes were shown by blue arrows.
(F) Quantification of the 4-thiouridine (4SU) /U ratio of YTHDF1- and YTHDF2-bound RNAs. Nascent transcribed mRNAs were labeled by 4SU for 1 hr. RNAs bound by YTHDF1 or YTHDF2 were isolated at 2 or 4 hr post-labeling, then analyzed by LC-MS/ MS. Error bars represent mean ± SD, n = 2. The results indicate that YTHDF1 binds nascent RNA before YTHDF2.
See also Figure S6.

