
Figure 4.
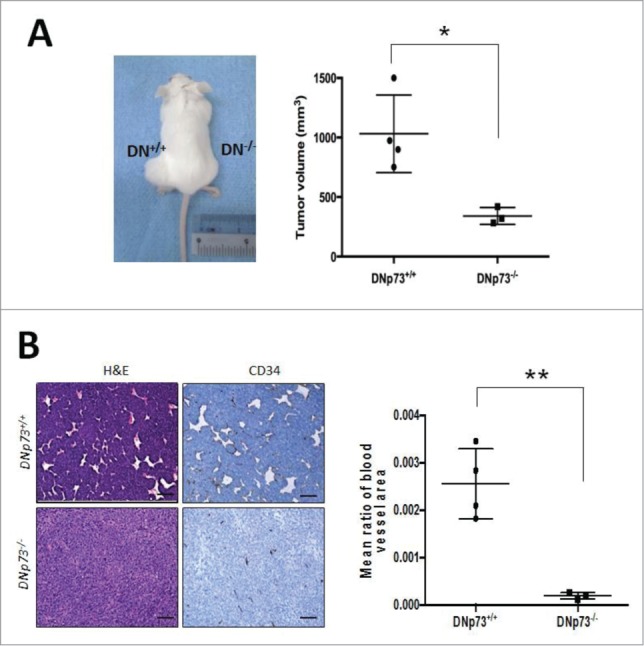
DNp73 supports tumor formation and angiogenesis. (A and B) SCID mice were injected subcutaneously on either flanks with E1a/Ras transformed DNp73+/+ and DNp73−/− cells and tumors were analyzed for tumor growth and blood vessel formation. Graph shows the size of tumors derived from each mouse [each dot represents a mouse/tumor; n = 4 (WT), n = 3 (KO)] with a representative mouse shown (A). Tumors were stained for H&E and CD34 (B). Scale bars: 100μm. Image is representative of all tumors analyzed. *p<0 .05 **p<0 .01.