Figure 1.

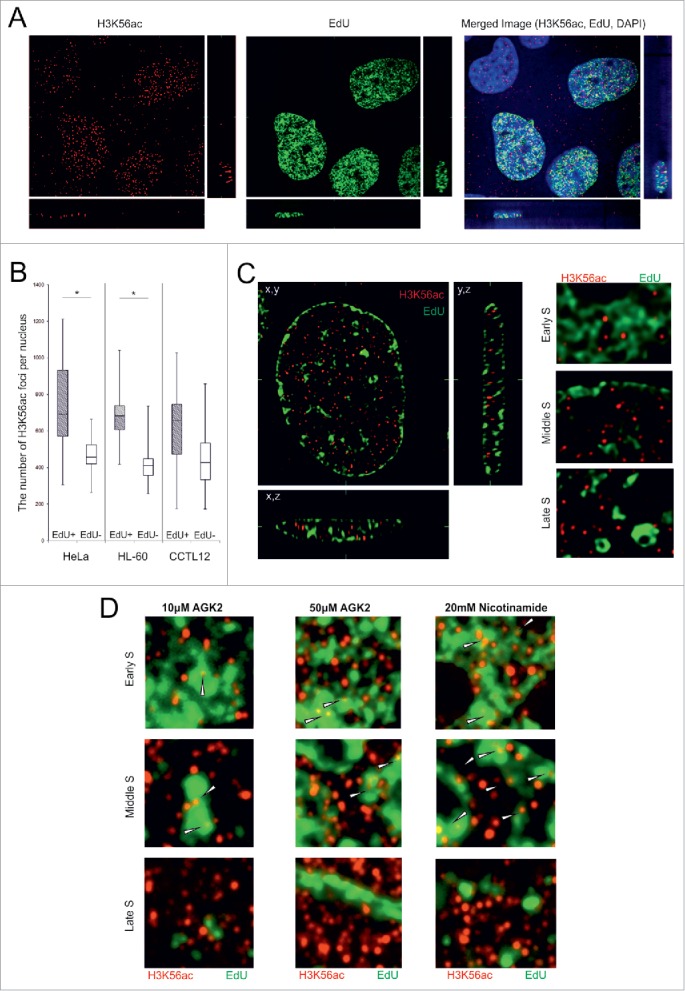
The level of H3K56ac foci are increased in EdU positive cells. (A) HeLa cells were treated with EdU for 2 h before the paraformaldehyde fixation. An increased density of the K56ac (red) foci was observed in the EdU-positive (green) cells. The cell nuclei were counterstained with DAPI (blue). The image represents one slice of the object in the x,y, x,z and y,z planes. (B) The number of H3K56ac foci was increased in EdU-positive cells. The chart represents the number of H3K56ac foci in the EdU-positive (gray box plots) and EdU-negative nuclei (white) in the HeLa, HL-60 and embryonic CCTL12 cell lines. The range of the error bars encompasses the lowest and highest values (n>50 for each measurement; *P value< 0.05; U-test). (C) The H3K56ac foci did not colocalize with the bright EdU-positive areas in the HeLa cells. Representative zoomed images of HeLa nucleus in the early, middle and late S sub-phase are shown (original images in Fig. S2). (D) The colocalization between H3K56ac foci and the EdU bright areas after sirtuin inhibition in the HeLa cells. (zoomed images, original images in Figs. S4-S6).
