Figure 2.

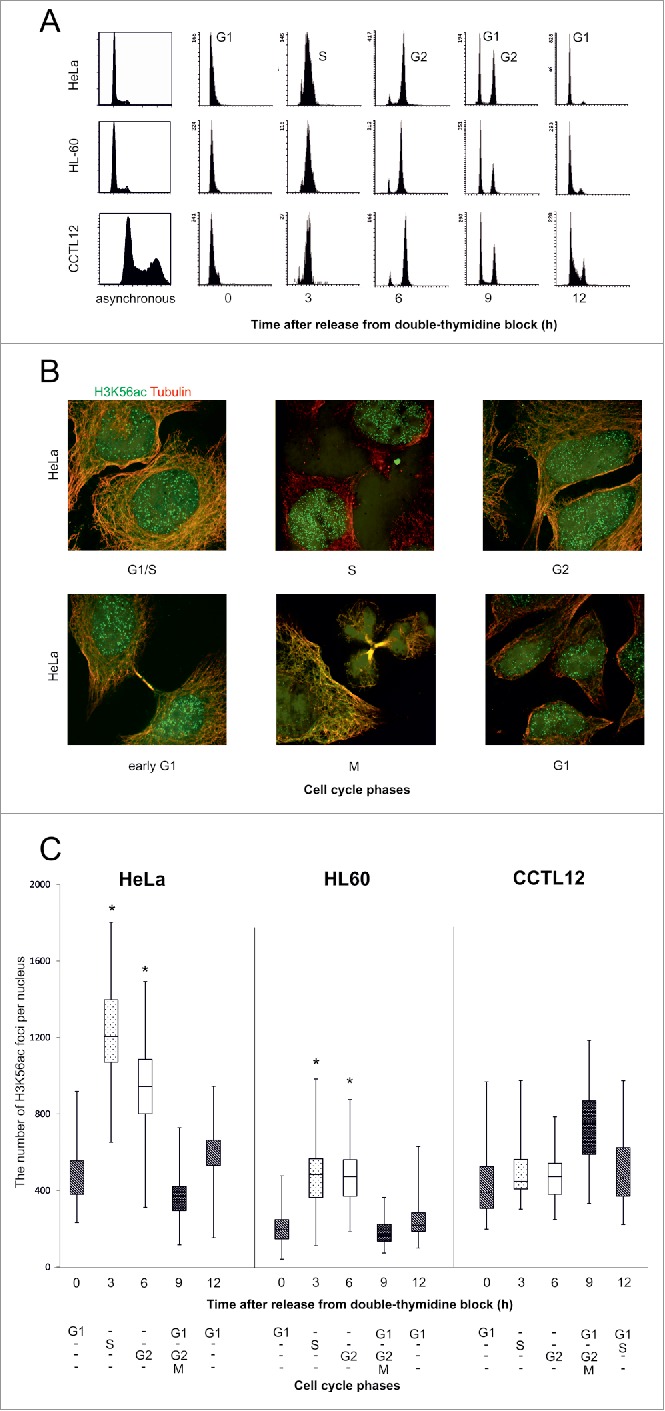
The number of H3K56ac foci during the cell cycle. (A) Flow cytometry analysis of the cell cycle stages. Propidium iodide staining was used to quantify the DNA in the cell nuclei. G1 and M phases are represented by the left peak and G2 phase by the right peak. The cells were synchronized into the G1/S transition point during thymidine blockade. After releasing the thymidine block, the cells were synchronized into purified populations of S (3 h), G2 (6 h) and G1 phase (12 h). The majority of the mitotic cells were observed in G2/M/G1 phase (9 h). (B) HeLa cells were treated with thymidine to induce a G1/S phase block. After thymidine release, the number of H3K56ac (green) foci were analyzed every 3 h in the separate cell cycle phases. Beta-tubulin (red) was used to identify the daughter cells in early G1 phase. H3K56ac did not localize to the chromatin in mitotic cells. (C) The number of H3K56ac foci in distinct cell cycle phases. In the HeLa and HL-60 cancer cell lines, H3K56ac levels were increased in the S (dotted blot) and G2 (white) phases. The error bars represent the maximum and minimum values (n>50 for each measurement, * P value< 0.05, U-test).
