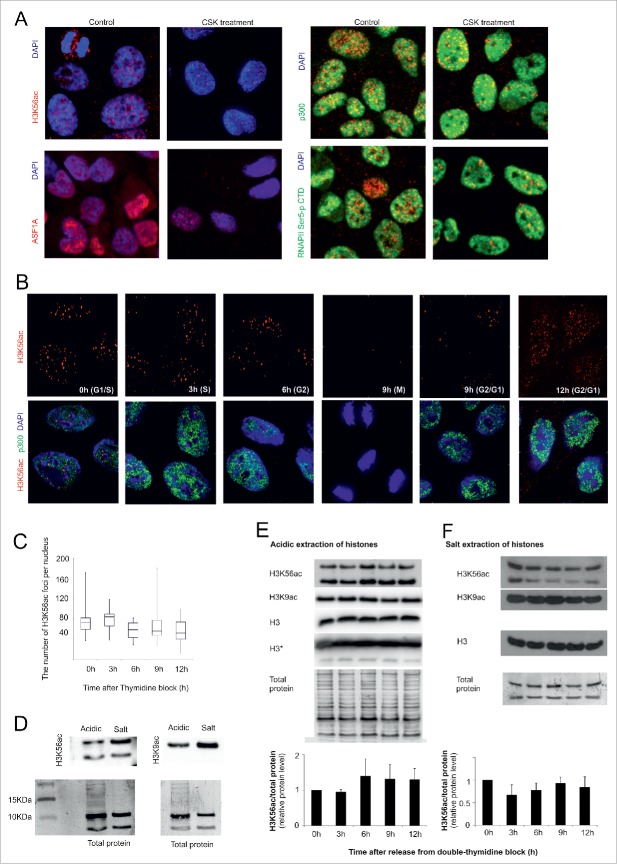
Figure 4. (see previous page).
H3K56ac and ASF1A are not tightly connected to chromatin. (A) HeLa cells were incubated with CSK buffer before formaldehyde fixation. After the CSK buffer treatment, the level of H3K56ac and ASF1A in the nucleus was decreased. We did not observe any change in the distribution of the RNA Polymerase CTD domain (phosphorylated on serine 5) or p300. (B) The H3K56ac foci level (red) at different stages of the HeLa cell cycle. As a control for CSK buffer efficiency, we used the nuclear staining of p300 (green). (C) The chart indicates the number of H3K56ac foci in the HeLa cell nuclei after CSK treatment at different time points after the release from the thymidine block. The error bars represent the maximum and minimum values (n>50 for each measurement). (D) The difference between H3K56ac, H3K9ac and the total protein after acidic and salt extraction of histones. (E) The nuclear histones were concentrated by acid extraction. A small, non-significant increase in the H3k56ac level was observed during G2 phase (6 h). The H3K9ac level decreased at 9 h after release of the thymidine block. The charts indicate the changes in the H3K56ac levels during cell cycle progression in the histones isolated by acid extraction (n=3). The error bars represent the the standard deviation values (n=3). The antigen intensity was normalized to the total protein. The total protein was visualized by Amido Black staining and was used as a loading control. (F) The chromatin fraction of the H3 and H4 histones was isolated by salt extraction. No significant changes in H3K56ac levels were observed. The H3K9ac level decreased at 9 and 12 h after release of the thymidine block. The total protein was used as loading control. The charts represent the changes in the H3K56ac levels during cell cycle progression in the histones isolated by acid extraction (n=3).

