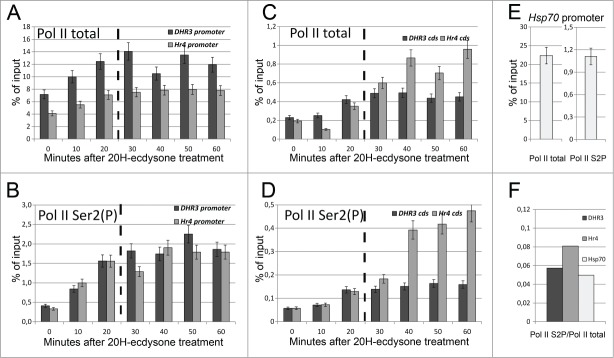
Figure 4.
DHR3 and Hr4 promoters are regulated via a Pol II pausing mechanism and activated 20 minutes after ecdysone treatment. ChIP analysis of the total (A and C) and the CTD Ser2 phosphorylated (B and D) RNA polymerase II recruitment on DHR3 (dark gray) and Hr4 (light gray) promoters and coding regions after transcription induction of corresponding genes with 20-hydroxyecdysone treatment. The x-axis represents the time (minutes) after 20-hydroxyecdysone addition, and the y-axis represents the amount of precipitated DNA, which is presented as a percentage of the input. ChIP analysis of the total and the CTD Ser2 phosphorylated RNA polymerase II (E) recruitment on the Hsp70 promoter in untreated (corresponding to 0 min point) S2 Schneider cells. All experiments were performed at least thrice. Error bars represent the accuracy of measurement. Panel (F) graphs demonstrate the ratio between phosphorylated and total RNA polymerase II in the untreated (corresponding to 0 min point) S2 Schneider cells, which have been calculated for the DHR3, Hr4 and Hsp70 promoters.

