
Figure 3.
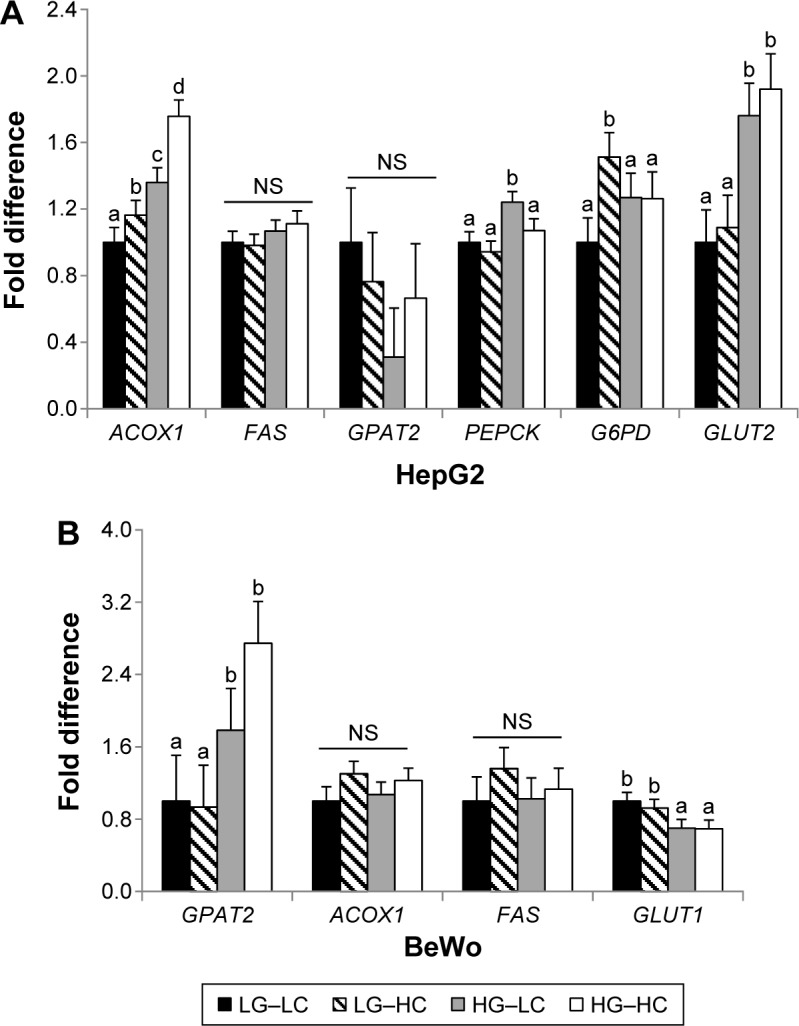
Glucose and fatty acid metabolic gene expression in HepG2 (A) and BeWo (B) cells after 72 or 96 hours of cultivation in different choline and glucose concentrations. LG–LC (black bars): low-glucose, low-choline; LG–HC (hatched bars): low-glucose, high-choline; HG–LC (gray bars): high-glucose, low-choline; HG–HC (open bars): high-glucose, high-choline. Different letters indicate significant difference, P < 0.05.
Abbreviations: NS, not statistically significant; ACOX1, peroxisomal acyl-coenzyme A oxidase 1; FAS, fatty acid synthase; GLUT, glucose transporter; G6PD, glucose-6-phosphate dehydrogenase; GPAT2, glycerol-3-phosphate acyltransferase 2; PEPCK, phosphoenolpyruvate carboxykinase.