
Figure 1.
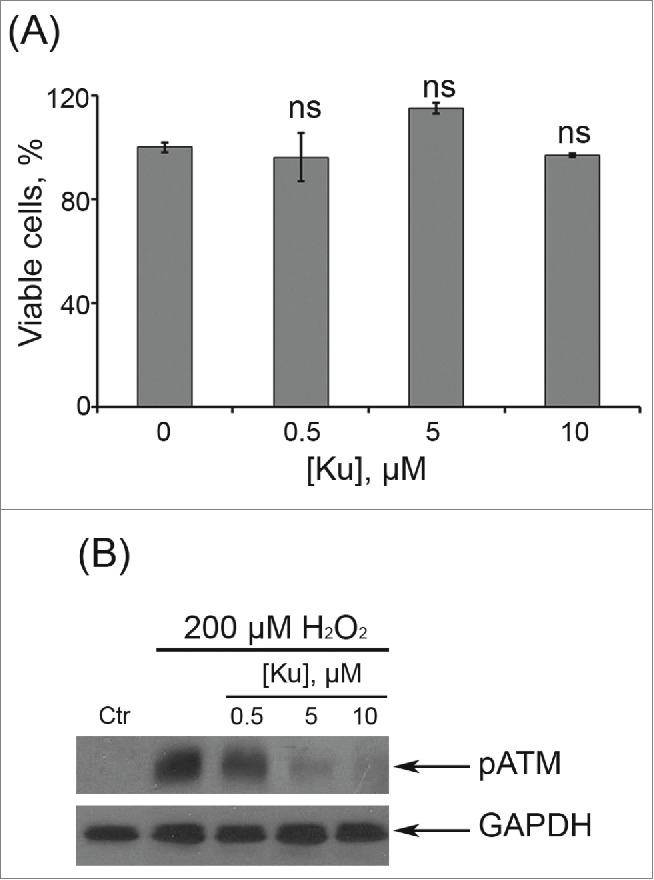
Dose-dependent effects of Ku application. (A) Cells were either treated or not with Ku at indicated concentrations. The percentage of viable cells was evaluated in 24 h after treatment using MTT assay as described in “Materials and Methods” section. Results are shown as a percent of control. M ± SD, N = 3. (B) Immunoblot analysis of H2O2-induced ATM phosphorylation. Representative results of the three experiments are shown in the figure. (Ctr – control). GAPDH was used as loading control.