Figure 5.

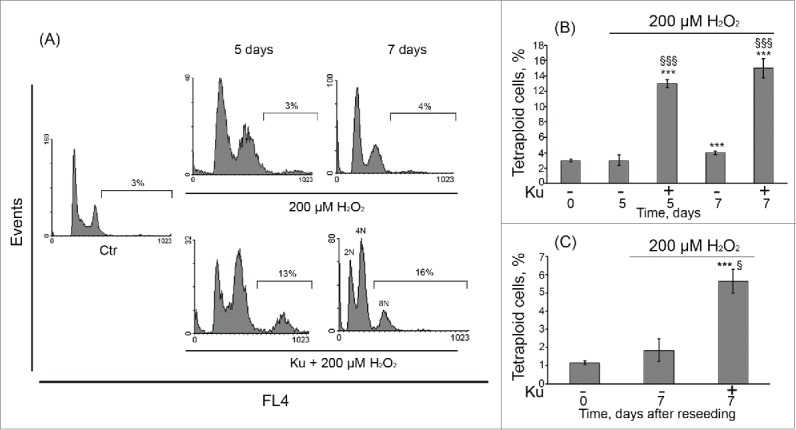
Tetraploidization of senescent hMESCs induced by Ku application. (A) hMESCs were left untreated (Ctr-control) or were treated either with H2O2 alone or in presence of the inhibitor and analyzed by FACS at indicated time points. The percentage of cells with DNA content > 4n is given. Representative FACS analyses are shown. (B) Quantification of tetraploidy induced by Ku. hMESCs were treated and analyzed as in (A). M ± SD, N = 3, ***p<0.005, versus control, §§§p<0.005, versus H2O2-treated cells, ns – not significant (Ctr – control). (C) Viability of the Ku-induced tetraploid cells. hMESCs were treated as in (A), then cells were reseeded in 5 d, additionally cultured for 7 d and analyzed by FACS. M ± SD, N = 3, ***p<0.005, versus control, §p<0.05, versus H2O2-treated cells. Ctr – control.
