
Figure 9.
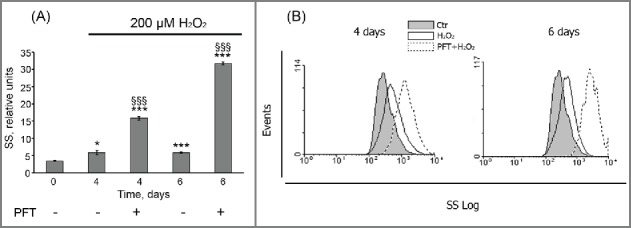
PFT promoted an internal granularity increase in H2O2-treated hMESCs. (A) Cells were treated as indicated in legend to Figure 8. Cell granularity was determined at indicated time points as the side scatter (SS) alterations. M ± SD, N = 3, *p<0.05, §§§ p<0.005, versus control, §§§p<0.005, versus H2O2-treated cells. Ctr – control. (B) Typical presentation of SS, reflecting the internal granularity of the cells. Data were obtained by light-scattering cytometry with using Win MDI program version 2.8.