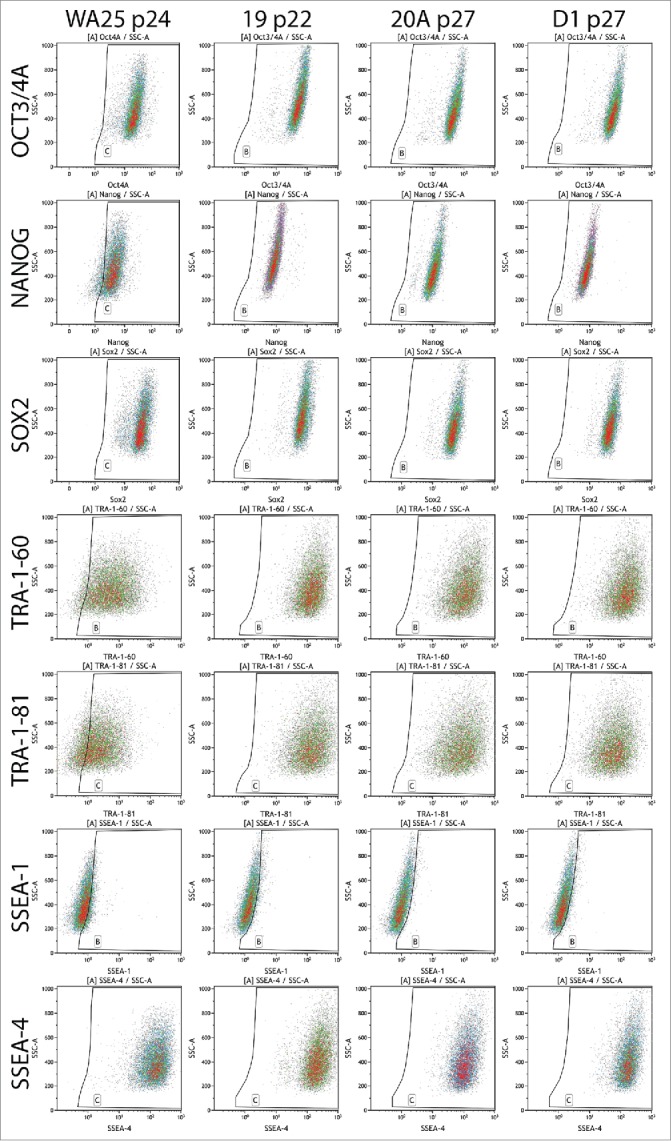
Figure 4.

Flow cytometric analysis of the expression of ESC markers in AF-iPSC in their mature state grown in VTN/E8. All 3 lines of AF-iPSC (19, 20A, D1) showed typical ESC marker expression profile, comparable to that of a control ESC line WA25 also derived and cultured in VTN/E8. The WA25 line showed slightly lower intensities of Nanog and TRA antigen expression and it was more prone to spontaneous differentiation in culture.
