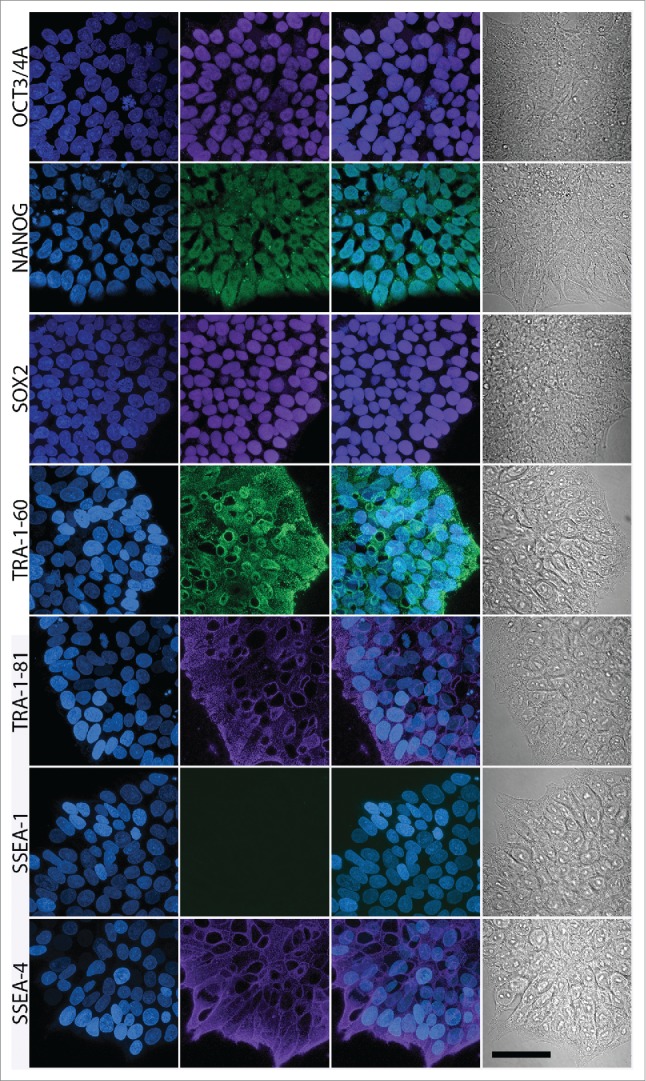
Figure 5.

Confocal microscopy-based immunocytochemical analysis of the expression of ESC markers in AF-iPSC in their mature state grown in VTN/E8. Images of colonies of D1 line are depicted on the figure. Oct3/4A, Nanog and Sox2 displayed clear signal localized in the nucleus while TRA-1-60, TRA-1-81 and SSEA-4 displayed surface localization. SSEA-1 was negative. The projections were reconstructed from the fluorescence signal spanning all of the individual scanned slices using the Maximum Intensity Projection algorithm. The first column contains DAPI images, second column contains marker fluorescence, third column contains DAPI and marker overlay images and the fourth column contains a single-slice leftover transmitted light-based representation of the same colonies. Scale bar = 50 µm.
