Figure 6.
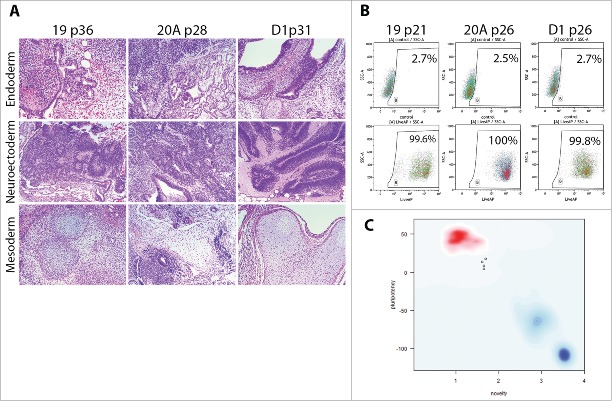
Demonstration of pluripotency in AF-iPSC by 3 methods – in-vivo xenografts, alkaline phosphatase activity and transcriptomics (A). Histological analysis (H&E staining) of teratomas formed by means of in-vivo differentiation of AF-iPSC (19, 20A, D1). Cell clumps were injected subcutaneously into scid-beige mice and allowed to proliferate and differentiate for 6 to 9 weeks. The resulting teratomas showed presence of various tissues representative of all 3 germ layers – endoderm, neuroectoderm, mesoderm – demonstrating pluripotency of the injected cells. (B). Alkaline phosphatase activity in AF-iPSC measured by flow cytometry using AP Live Stain. The majority of the cells displayed bright fluorescence, supporting their pluripotency. (C). PluriTest - global gene expression microarray data-based in-silico evaluation of pluripotency. AF-iPSC and WA25 (control ESC line) were tested. Y axis – pluripotency score, X axis – novelty score. Red spot represents cluster area of validated PSC lines grown in standard feeder layer- and KSR-based culture condition. Blue spot represents the cluster area of differentiated cells. Faint blue spot represents the cluster area of partially pluripotent stem cells. The pluripotency and novelty score both indicated pluripotency of the lines tested, however, the plot revealed a deviation from the red cluster area indicating a unique expression signature possibly attributable to the defined culture condition.

