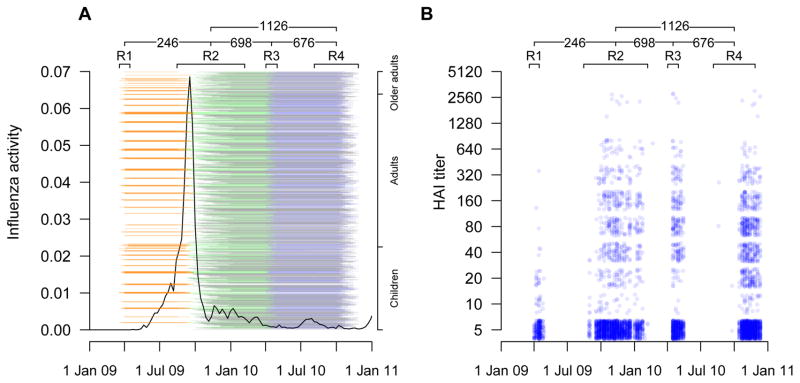
Figure 1.
Panel A: Timeline of the study and local influenza virus activity for H1N1pdm09 epidemic. Black lines represent the local influenza activity. Orange, green, blue and black lines represent the pairs of sera draw from round 1+2 (246 pairs), round 2+3 (698 pairs), round 3+4 (676 pairs) and round 2+4 (1126 pairs), respectively. Collection dates are adjusted for the 2-week delay from infection to rise in antibody titer. Participants were ordered vertically by age. Panel B: Antibody titer measurements over calendar time. A value of 5 corresponds to a titer measured at <10.

