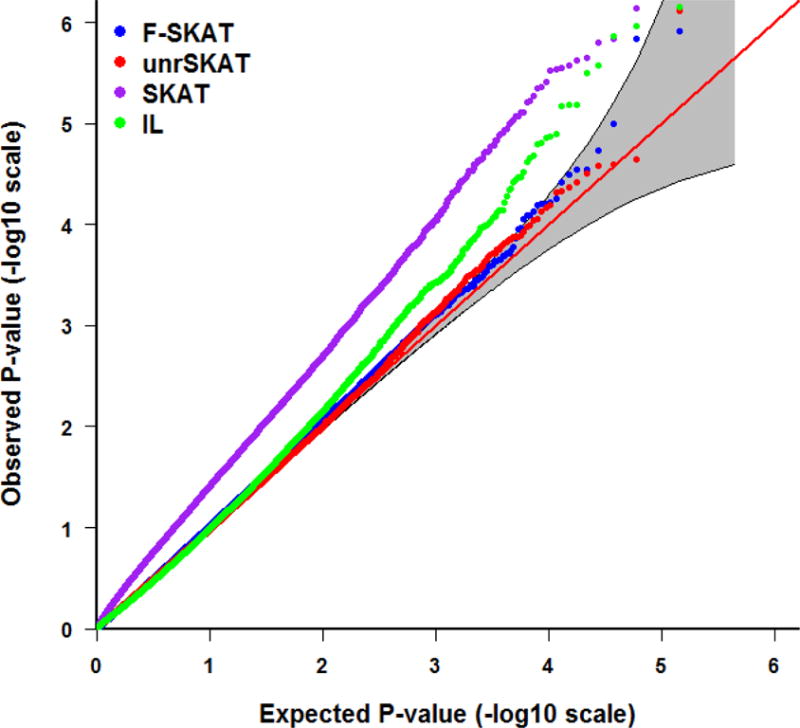
Figure 3.

QQ plot of the p-values for F-SKAT, unrSKAT, SKAT, and IL for families with flexible numbers of offspring from the null simulation, with 95% pointwise confidence band (gray area) that is computed under the assumption of the p-values being drawn independently from a uniform [0, 1] distribution.
