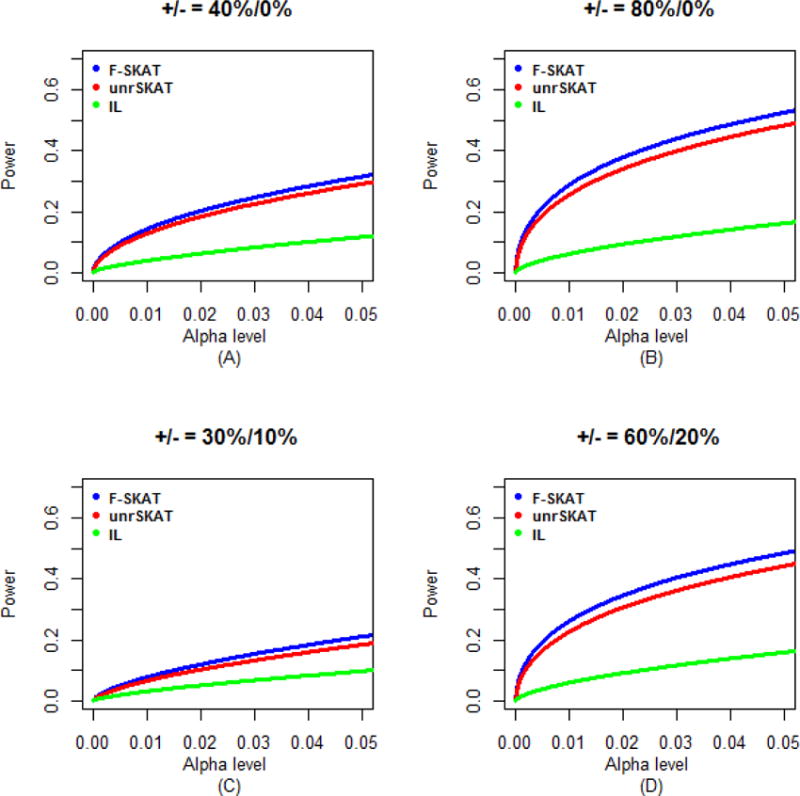
Figure 6.

Power comparisons of F-SKAT, unrSKAT, and IL for data of families with flexible numbers of offspring (α level is from 0 to 0.05). (A) 40% disease variants scenario; (B) 80% disease variants scenario; (C) 30% disease variants and 10% protective variants scenario; (D) 60% disease variants and 20% protective variants scenario.
